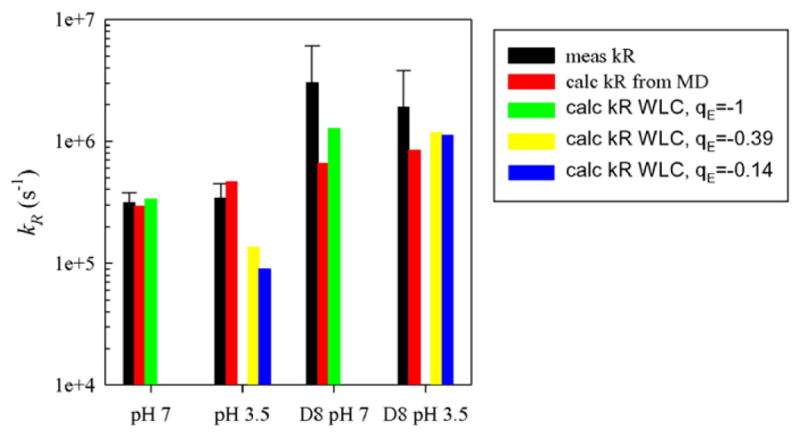
Fig. 5.

Comparison of measured and calculated values of kR for both peptides at 40 °C. For the re-weighted WLC model (green, yellow and blue bars), γ=5andσ=3 and the charge on the glutamic acid residue was adjusted as indicated. The charges on other residues were assigned as expected at pH 7 and pH 3.5. (For interpretation of the references to colour in this figure legend, the reader is referred to the web version of this article.)
