
FIG 8 .
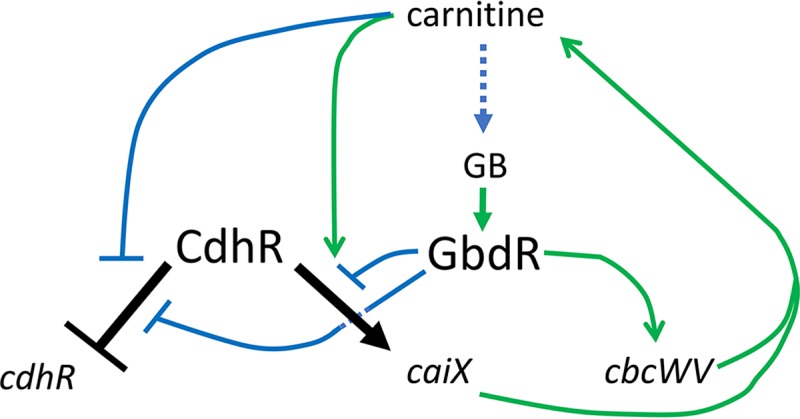
Regulation of caiX and cdhR by CdhR and GbdR. Shown is a genetic network diagram of the interactions known and proposed in this study. Arrows indicate positive interactions (induction or activation), and T-bars indicate negative interactions (repression or other inhibition). The regulatory steps are black for CdhR and green or blue for interactions between other members in the network. The dotted blue line from carnitine to glycine betaine (GB) marks the metabolic conversion noted in Fig. 1C.