Fig. 6.

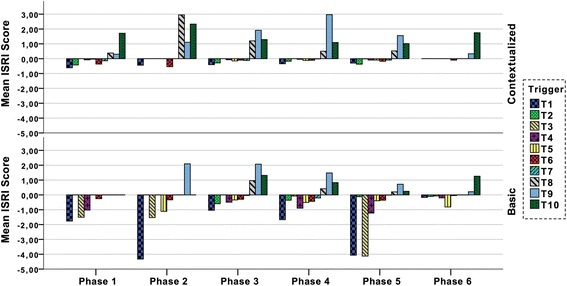
The ISRI score per phase split into the individual triggers. The sum of the 10 trigger values constitutes the immersion score shown in Fig. 5. Each trigger value is the mean of all teams (n = 12)

The ISRI score per phase split into the individual triggers. The sum of the 10 trigger values constitutes the immersion score shown in Fig. 5. Each trigger value is the mean of all teams (n = 12)