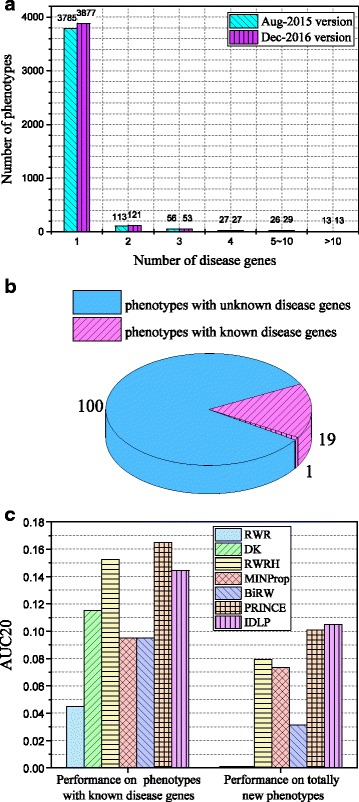
Fig. 2.

Data Analysis. a The phenotype distribution based on the genes it associates with. b The distribution of newly added phenotypes based on whether they have known disease causing gene(s). c The AUC20 scores of different methods in two situations: 1. phenotypes with known disease genes are used as queries (left); 2. phenotypes with unknown disease genes are used as queries (right)
