
Fig. 4.
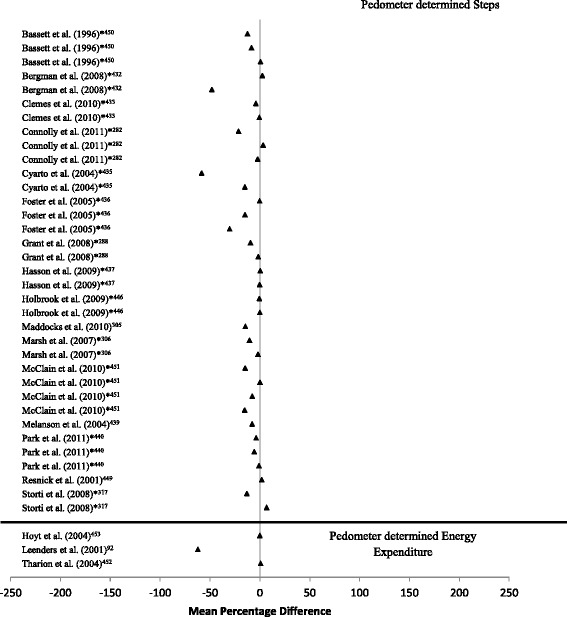
Forest plot of mean percentage difference between pedometer determined step count/energy expenditure compared to criterion measure (direct observation/doubly labelled water respectively). * denotes multiple devices compared in the same study
Official websites use .gov
A
.gov website belongs to an official
government organization in the United States.
Secure .gov websites use HTTPS
A lock (
) or https:// means you've safely
connected to the .gov website. Share sensitive
information only on official, secure websites.
Forest plot of mean percentage difference between pedometer determined step count/energy expenditure compared to criterion measure (direct observation/doubly labelled water respectively). * denotes multiple devices compared in the same study