Fig. 1.

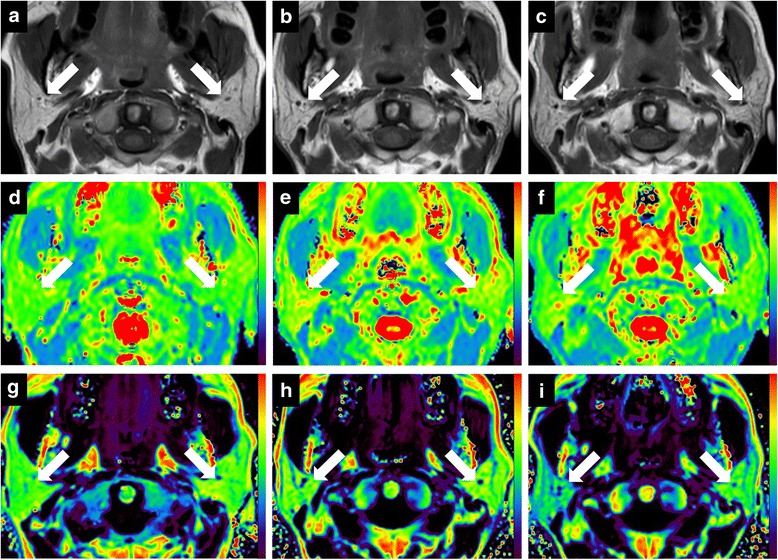
Dynamic changes of T1-weighted images (a-c), T2 maps (d-f), and fat fraction (FF) (g-i) maps of bilateral parotid glands (white arrows) in one patient with nasopharyngeal carcinoma (NPC) within 2 weeks before radiotherapy (pre-RT), 5 weeks after the beginning of radiotherapy (mid-RT), and 4 weeks after radiotherapy (post-RT), respectively. T1-weighted images show that right and left parotid volume are 30.1 cm3 and 30.2 cm3 (pre-RT, a), 21.9 cm3 and 20.1 cm3 (mid-RT, b), and 23.2 cm3 and 20.2 cm3 (post-RT, c), respectively. T2 maps show that right and left parotid T2 values are 70.9 msec and 65.8 msec (pre-RT, d), 75.4 msec and 75.1 msec (mid-RT, e), and 75.8 msec and 72.2 msec (post-RT, f), respectively. FF maps show that right and left parotid FF values are 54.9% and 57.4% (pre-RT, g), 59.0% and 57.3% (mid-RT, h), and 45.9% and 50.4% (post-RT, i), respectively
