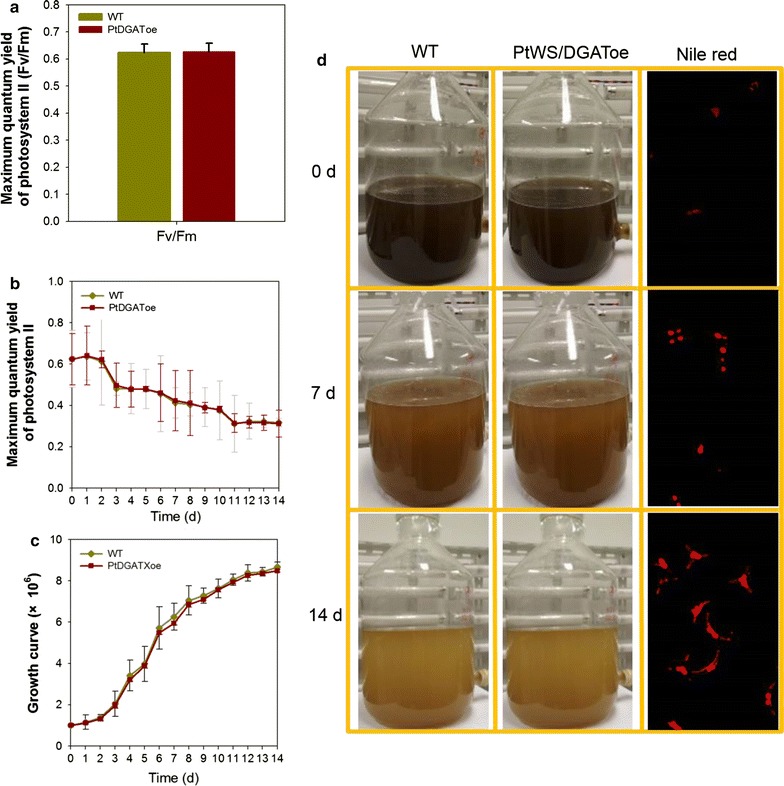
Fig. 5.

Assessment of the production performance of PtWS/DGAToe. a Typical results of photosynthetic measurements of WT and the PtWS/DGAToe strains under nitrogen repletion conditions. b Comparison of maximum quantum yield of photosystem II of WT and the PtWS/DGAToe strains under nitrogen depletion conditions. c Growth of WT and the PtWS/DGAToe lines under nitrogen repletion conditions. d Image of WT and the PtWS/DGAToe lines following nitrogen depletion in a 10-L photobioreactor. Only typical results of Nile red staining are shown in the right column since no significant difference is observed between WT and the PtWS/DGAToe cells. PtWS/DGAToe, PtWS/DGAT overexpression P. tricornutum
