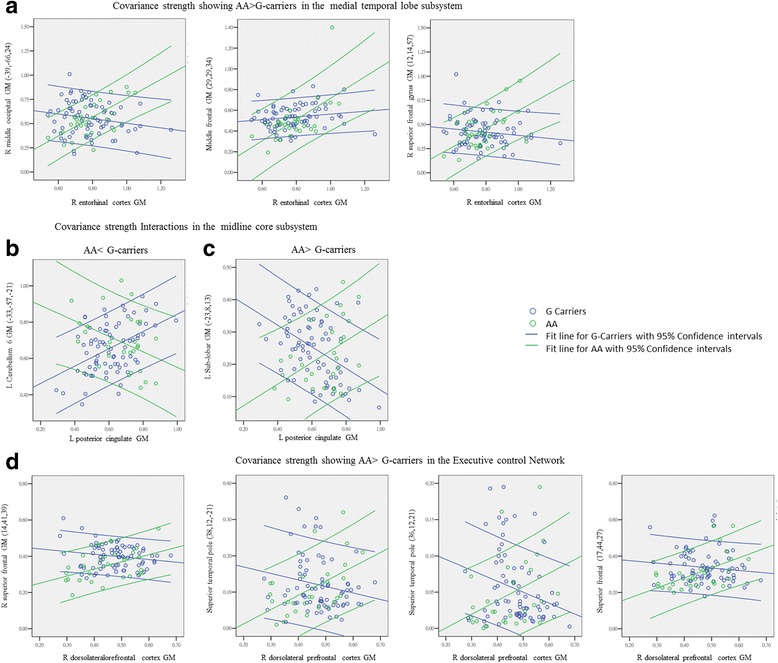
Fig. 2.

Peak clusters showing significant interactions of B-cell chronic lymphocytic leukemia/lymphoma-2 (Bcl-2) AA and G carriers from the (a) default mode network anchored by entorhinal cortex (AA > G carriers); midline core subsystems with interactions of (b) AA < G carriers or (c) AA > G carriers; (d) executive control network by the dorsolateral prefrontal cortex (AA > G carriers). (x, y, z) = Montreal Neurological Institute coordinates. G carriers: blue; AA genotype: green. The colored lines represent the covariance strengths between seed and peak cluster with 95% CIs as boundaries. GM Gray matter, R right, L Left
