Fig. 6.

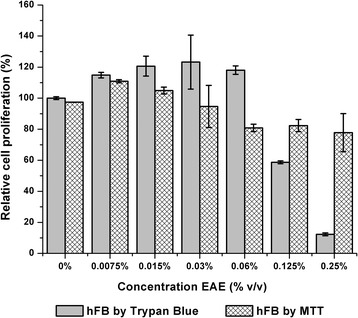
Comparative of relative cell proliferation percentage of hFB cell line in the ethanolic extract (EAE) by MTT and Trypan blue test. Error bars represent standard deviation

Comparative of relative cell proliferation percentage of hFB cell line in the ethanolic extract (EAE) by MTT and Trypan blue test. Error bars represent standard deviation