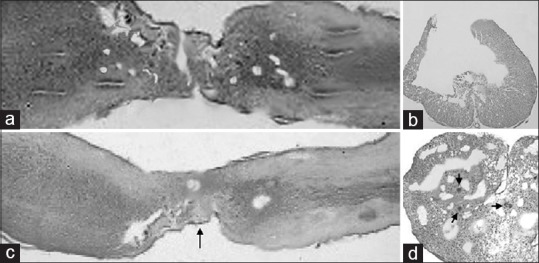
Figure 5.

Light microscopy in FGG (a, b) vs. MSCG (c and d) at the injury site 10 weeks after injury. (a) FGG sagittal (HE scale bars = 400 μm); (b) FGG axial cut at the level of glial scar (HE scale bars = 200 μm); (c) MSCG sagittal (HE scale bars = 400 μm). Black arrow indicates the neuroglial bridges between the spinal cord stumps at the injury site. (d) MSCG axial (HE scale bars = 200 μm). Black arrows show a tight distribution of the neuroglial cells around the vessels
