
Figure 6.
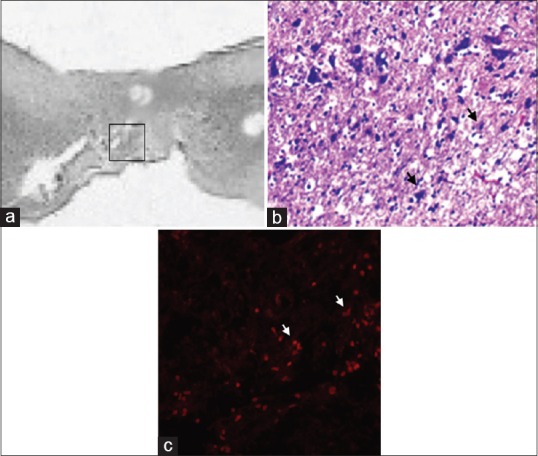
(a) Sagittal section (HE scale bars = 400 μm) of the harvested rat spinal cord in MSCG at 10th week after injury. Squared area indicates the site of sampling. (b) distribution of MSCs (black arrows) at the injury site in the MSCG (HE × 40); (c) co-localizzation of dsRFP MSCs (white arrows) within the injury site (fluorescence microscopy, excitation light 568 nm)