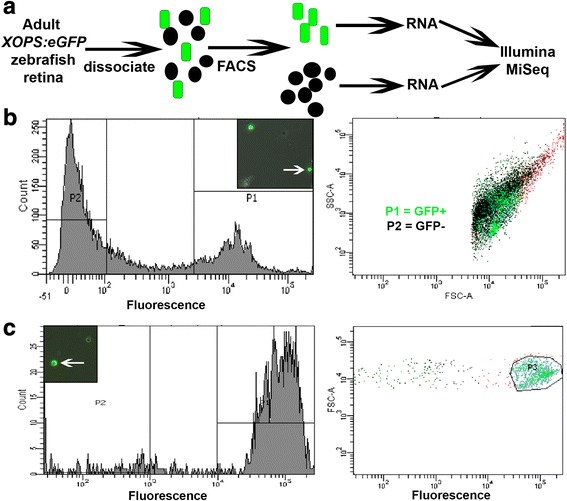
Fig. 1.

Dissociation, FACS separation, and RNA-seq analysis of GFP+ rod photoreceptors and GFP- retinal cells. a Experimental procedure. b Representative FACS results showing dissociated cells (inset; arrow indicates GFP+ cell), GFP+ population collected in P1, GFP- population collected in P2. Cells not in P1 or P2 are in red in the second panel. c Post-sort analysis of a sorted GFP+ population by fluorescence microscopy (inset; arrow indicates GFP+ cell) and FACS. SSC, side scatter (reflecting object complexity); FSC, forward scatter (reflecting object size)
