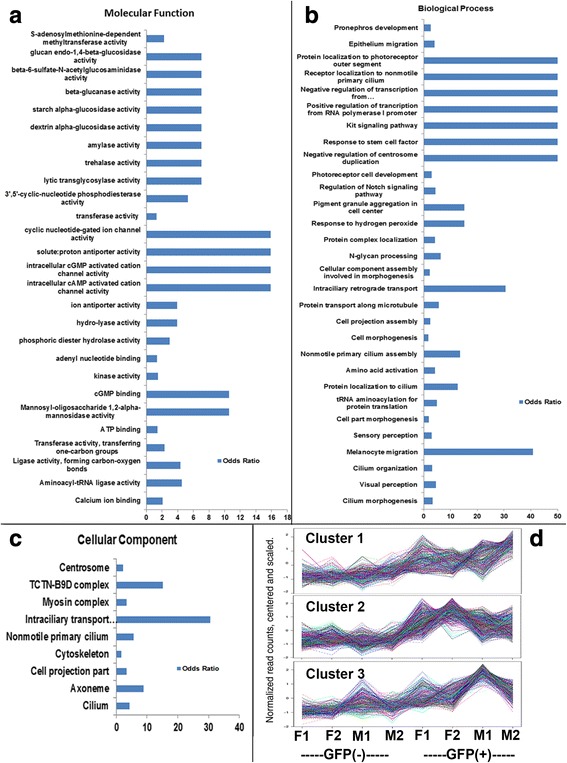
Fig. 2.

Gene ontology (GO) and hierarchical cluster analysis. a-c Molecular functions (a), biological processes (b), and cellular components (c) overrepresented in the GFP+ (rod photoreceptor) cell population (p < 0.01). d Hierarchical clustering of rod-enriched transcripts reveals only three, highly similar clusters. F, female; M, male
