Abstract
Under normal conditions we continuously breathe 78% nitrogen (N2) such that the body tissues and fluids are saturated with dissolved N2. For normobaric medical gas administration at high concentrations, the N2 concentration must be less than that in the ambient atmosphere; therefore, nitrogen will begin to be released by the body tissues. There is a need to estimate the time needed for denitrogenation in the planning of surgical procedures. In this paper we will describe the application of a physiologically based pharmacokinetic model to denitrogenation kinetics. The results are compared to the data resulting from experiments in the literature that measured the end tidal N2 concentration while breathing 100% oxygen in the form of moderately rapid and slow compartment time constants. It is shown that the model is in general agreement with published experimental data. Correlations for denitrogenation as a function of subject weight are provided.
Keywords: physiologically based pharmacokinetic model, nitrogen, washout, medical gas administration, nitrous oxide, xenon
INTRODUCTION
Under normal conditions we continuously breathe 78% nitrogen (N2) such that the body tissues and fluids are saturated with dissolved N2. For normobaric medical gas administration at high concentrations, the N2 concentration must be less than in the ambient atmosphere; therefore, N2 will begin to be released by the body tissues. For very high concentration administration of gases such as nitrous oxide (N2O), xenon (Xe), or even oxygen (O2) the quantity of N2 out gassing can be significant. Quantification of this process can be important for at least two reasons.
First, the released N2 gas leaves the body primarily through exhalation. For the anesthetic administration of nitrous oxide or xenon to intubated and ventilated patients the exhaled nitrogen will mix with the therapeutic gases in the recirculation gas breathing circuit resulting in a decrease in therapeutic gas concentration. Thus there must be a continuous fresh supply of therapeutic gas to maintain the concentration that is especially expensive for xenon.1 To reduce this expense a denitrogenation procedure prior to xenon administration is usually performed based on 100% O2 delivery.1
Second, for gases that have a greater solubility in blood than N2 there can be accumulation of gas in the bowel and other body cavities.2,3,4 This is especially true for nitrous oxide that has an Ostwald solubility coefficient of 0.469 compared to 0.0148 for N2 in human whole blood (mL of gas per mL of liquid at 37°C).5
Thus there is a need to estimate the time needed for denitrogenation in the planning of surgical procedures. In this paper we will describe the application of a physiologically based pharmacokinetic model to denitrogenation kinetics. The results are compared to the data resulting from an elegant set of experiments by Lundin6 that measured the end tidal N2 concentration in six adult subjects while breathing 100% O2 in the form of moderately rapid and slow compartment time constants. Furthermore, these data are the most complete set of inert gas washout from humans in the literature; thus, this comparison serves as a validation of the model. Other aspects of the denitrogenation process are also explored including the effect of subject weight and a comparison of the exhaled concentration to total body clearance.
MATERIALS AND METHODS
This study employs a physiologically based pharmacokinetic model developed by Lockwood7 for anesthetic gases that has been employed within the Simbiology Toolbox of MATLAB (Mathworks, Natick, MA, USA).8 The model considers all transport to be perfusion limited, that there is no metabolism, and all excretion is through expiration via the lung. Here we present the partition coefficients for N2 (Table 1) and a detailed explanation of the compartment consisting of the alveolar gas exchange region of the lung (Figure 1) as these are the results comparable to the published experimental data by Lundin.6
Table 1.
Physiological data and partition coefficients used for the model
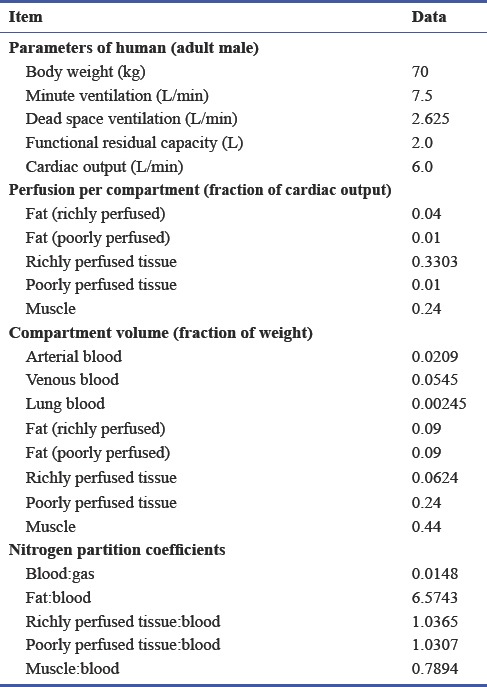
Figure 1.
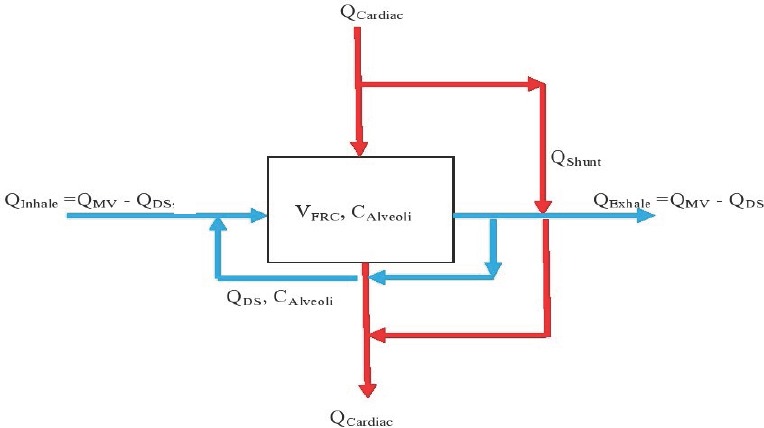
Schematic of transport through the alveolar gas exchange region of the lung.
Note: QCardiac: Cardiac outpur flow rate; QShunt: fraction of cardiac output that passes by the gas exchange region; CArterial: arterial blood concentration, QMV: minute ventilation; QDS: dead space flow, CInhale: inhaled concentration; VFRC: functional residual capacity.
Figure 1 shows schematically how blood and gas pass through the alveoli, or gas exchange region, of the lung. On the blood side the venous blood arrives at the rate of QCardiac; a fraction QShunt (0.1 is used herein) bypasses the gas exchange region and remixes with oxygen enriched blood to obtain the full flow of QCardiac with mixed concentration CArterial. On the gas side the respiratory cycle is modeled with a simplified steady-state flow of inhaled gas at the rate of the minute ventilation (QMV) less a dead space flow (QDS) at concentration CInhale. This is mixed with the dead space flow at the concentration in the alveoli to make the flow through the gas exchange region QMV. An expression of molar exchange between blood and gas is as follows:

in which 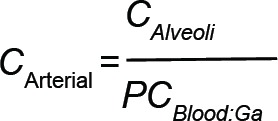 employs the blood:gas partition coefficient (PCBlood:Gas) to determine the arterial concentration and VFRC is the functional residual capacity (i.e., the gas volume in the lung).
Lundin's data6 are presented in the form of moderately rapid and slow compartment time constants that are calculated based on end tidal measurements in the exhaled gas, taken to be CExhale in the model. Roughly, the moderately rapid and slow time constants represent the relatively richly perfused and poorly perfused tissues as listed in Table 1. However, it was not possible to precisely match the model compartments with the experimental time constants. Therefore, the calculation method employed by Lundin as shown in Figure 2 based on the exhaled concentration was used.
Figure 2.
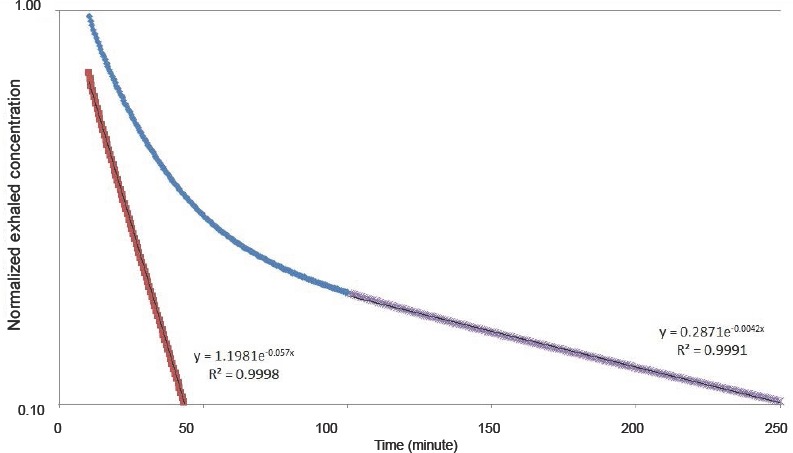
Calculation of time constants, which can be compared to Figure 2 in the Lundin's paper.6
Note: The slow time constant is found by fitting the data > 100 minutes to an exponential function (purple data) that appears linear on the semi-log plot. Results from this fit are subtracted from the original data (blue) between 10 and 60 minutes resulting in the red data. This is then fit to a second exponential to obtain the moderately rapid time constant. The data shown are for the 70 kg case. The concentration data have been normalized by the value at 10 minutes.
RESULTS
The simulated results are first provided in terms of the moderately rapid and slow time constants as a function of weight shown in Figure 3. Also shown in Figure 3 are the data from the six subjects realized from the experimental study found in the literature.6 There is general agreement between simulated and experimental results, though the variations in experimental results are clearly not completely correlated with weight.
Figure 3.
Comparison of time constants from Lundin7 and simulated as a function of weight: the moderately fast compartment (left) and the slow compartment (right).
Note: Curve fits for the simulated data are indicated.
The general agreement can be illustrated by considering the case with the largest difference between simulated and experimental results that occurs for the subject with a weight of 53 kg; 22 and 127 minutes and 15 and 194 minutes, for the moderately rapid and slow time constants respectively. However, these differences in time constants can still translate into reasonably accurate guidance for the exhaled concentration time series as shown in Figure 4.
Figure 4.
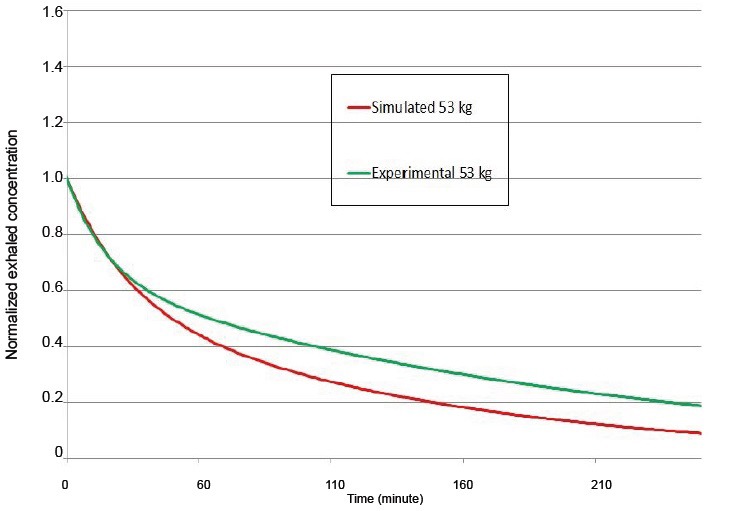
Simulated and experimental exhaled concentration time series for 53 kg normalized to the value at 10 minutes.
Note: The curves are produced using the equation:  .
.
DISCUSSION
We can speculate somewhat on the experimental data as to why the results are uncorrelated with weight. It can be understood from the model that weight is not the only variable that can influence the denitrogenation kinetics. Compartment volumes that represent fat content will be unique for individuals; thus for example, if the body mass index of the subjects were known a better correlation should be possible. Other parameters such as minute ventilation, cardiac output, functional residual capacity, and dead space volume are also not known for the experimental subjects, nor varied with weight in the simulated results.
The experiments are based on end tidal concentration measurements. A relevant question that can be addressed by the model is how this parameter reflects overall corporal denitrogenation. Thus, the moles of N2 in each compartment are summed and presented in comparison to the exhaled concentration in Figure 5. It can be seen that denitrogenation as measured in the exhaled gas is much faster than the clearance from tissues; for the exhaled gas concentration T1/2 = 28 minutes, for the tissue moles T1/2 = 183 minutes. This divergence can be understood by noting that the exhaled concentration is closely related to blood levels, while the majority of moles of gas are stored in fat that has a much slower denitrogenation speed.
Figure 5.
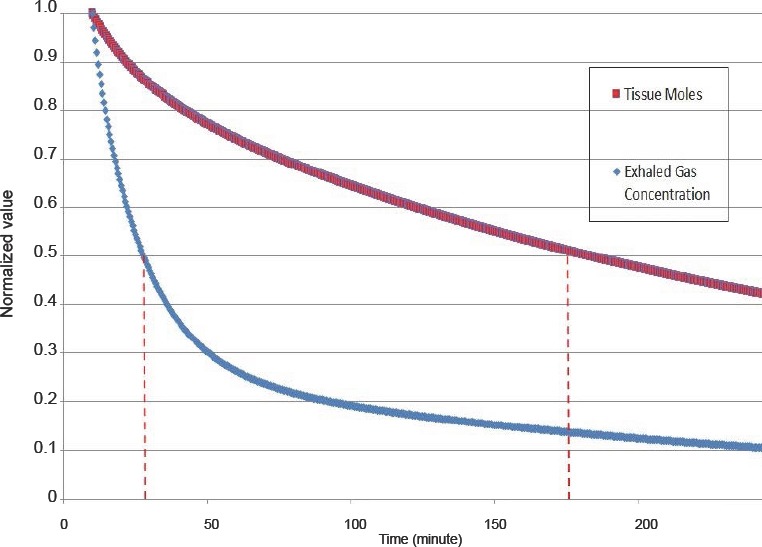
Comparison of tissue concentration and exhaled concentration for the 70 kg case.
Note: The T1/2 values are indicated by the dashed lines. For the exhaled gas concentration T1/2 = 28 minutes, for the tissue moles T1/2 = 183 minutes. Each time series is normalized by the value at 10 minutes.
These results might also be relevant for decompression illness.9 However, as there is some question on the relevance of the perfusion limited model for N2 decompression10 and the lack of a bubble initiation model11 in this study, for this application the results should be considered preliminary.
In conclusion, herein is presented a physiologically based model of denitrogenation kinetics that is in general agreement with published experimental data. Correlations for denitrogenation as a function of subject weight are provided.
Footnotes
Conflicts of interest
None declared.
Research ethics
No ethical issues were involved in this study.
Data sharing statement
Datasets analyzed during the current study are available from the corresponding author on reasonable request.
Plagiarism check
Checked twice by iThenticate.
Peer review
Externally peer reviewed.
REFERENCES
- 1.Rawat S, Dingley J. Closed-circuit xenon delivery using a standard anesthesia workstation. Anesth Analg. 2010;110:101–109. doi: 10.1213/ANE.0b013e3181be0e17. [DOI] [PubMed] [Google Scholar]
- 2.Reinelt H, Marx T, SchirmerU, Luederwald S, Topalidis P, Schmidt M. Diffusion of xenon and nitrous oxide into the bowel during mechanical ileus. Anesthesiology. 2002;96:512–513. doi: 10.1097/00000542-200202000-00043. [DOI] [PubMed] [Google Scholar]
- 3.Reinelt H, Schirmer U, Marx T, Topalidis P, Schmidt M. Diffusion of xenon and nitrous oxide into the bowel. Anesthesiology. 2001;94:475–477. doi: 10.1097/00000542-200103000-00019. discussion 6A. [DOI] [PubMed] [Google Scholar]
- 4.Steffey EP, Johnson BH, Eger EI, 2nd, Howland D., Jr Nitrous oxide: effect on accumulation rate and uptake of bowel gases. Anesth Analg. 1979;58:405–408. doi: 10.1213/00000539-197909000-00012. [DOI] [PubMed] [Google Scholar]
- 5.Lango T, Morland T, Brubakk AO. Diffusion coefficients and solubility coefficients for gases in biological fluids and tissues: a review. Undersea Hyperb Med. 1996;23:247–272. [PubMed] [Google Scholar]
- 6.Lundin G. Nitrogen elimination from the tissues during oxygen breathing and its relationship to the fat: muscle ratio and the localization of bends. J Physiol. 1960;152:167–175. doi: 10.1113/jphysiol.1960.sp006478. [DOI] [PMC free article] [PubMed] [Google Scholar]
- 7.Lockwood G. Theoretical context-sensitive elimination times for inhalation anaesthetics. Br J Anaesth. 2010;104:648–655. doi: 10.1093/bja/aeq051. [DOI] [PubMed] [Google Scholar]
- 8.Katz I, Palgen M, Murdock J, Martin AR, Farjot G, Caillibotte G. Gas transport during in vitro and in vivo preclinical testing of inert gas therapies. Med Gas Res. 2016;6:14–19. doi: 10.4103/2045-9912.179342. [DOI] [PMC free article] [PubMed] [Google Scholar]
- 9.Doolette DJ, Mitchell SJ. The physiological kinetics of nitrogen and the prevention of decompression sickness. Clin Pharmacokinet. 2001;40:1–14. doi: 10.2165/00003088-200140010-00001. [DOI] [PubMed] [Google Scholar]
- 10.Doolette DJ, Upton RN, Grant C. Diffusion-limited, but not perfusion-limited, compartmental models describe cerebral nitrous oxide kinetics at high and low cerebral blood flows. J Pharmacokinet Biopharm. 1998;26:649–672. doi: 10.1023/a:1020798806704. [DOI] [PubMed] [Google Scholar]
- 11.Doolette DJ. Uncertainties in predicting decompression illness. SPUMS J. 2000;30:31–36. [Google Scholar]


