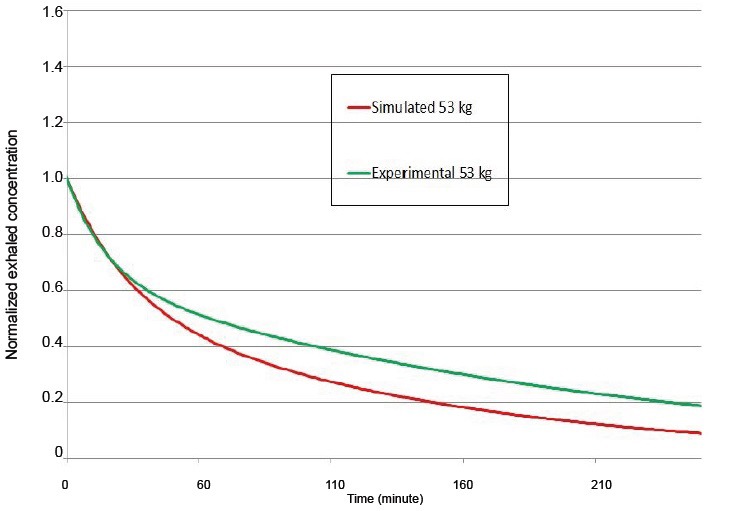
Figure 4.

Simulated and experimental exhaled concentration time series for 53 kg normalized to the value at 10 minutes.
Note: The curves are produced using the equation:  .
.

Simulated and experimental exhaled concentration time series for 53 kg normalized to the value at 10 minutes.
Note: The curves are produced using the equation:  .
.