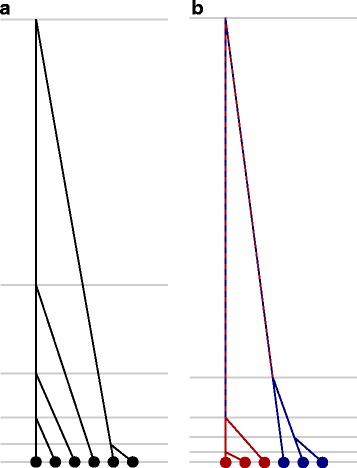
Fig. 1.

Example coalescent trees. Representative coalescent trees from (a) an unstructured population and (b) a population with two sub-populations with limited migration between them. Both trees have been scaled to the same total depth, but the distribution of expected coalescent times (grey lines) differ dramatically between the trees
