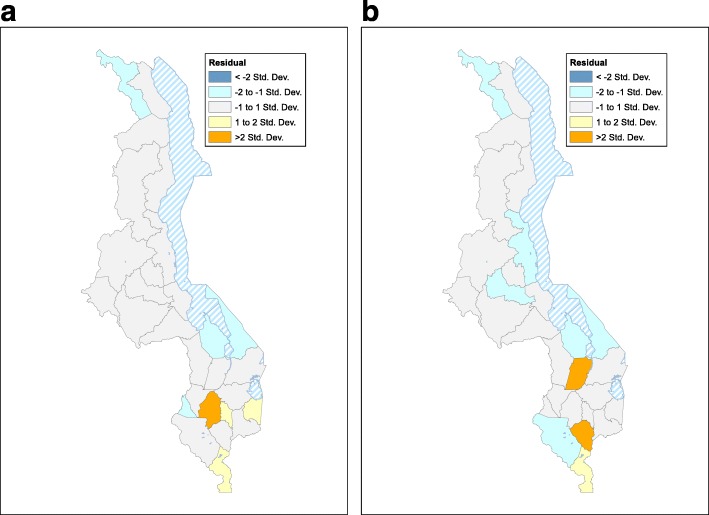
Fig. 4.
a Residuals from the spatial error regression model for women. The 20 districts where the residual is less than one standard deviation are shown in gray. The remaining colors show the degree to which the model under/overestimates prevalence in terms of the number of standard deviations. b Residuals from the spatial error regression model for men. The 19 districts where the residual is less than one standard deviation are shown in gray. The remaining colors show the degree to which the model under/overestimates prevalence in terms of the number of standard deviations

