Figure 2.

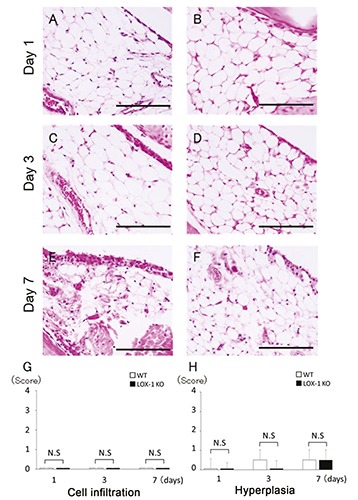
The panels show representative synovium in saline-injected group stained with H&E (A-F) at 400× magnification. Synovium of WT mice (A, C, E) and LOX-1 KO mice (B, D, F) at day 1, 3, and 7 after the saline injection. No inflammatory cell infiltration was observed in the saline-injected knees of both WT (A, C, E) and LOX-1 KO mice (B, D, and F). No obvious synovial hyperplasia was observed in the saline-injected knees of both WT (A, C, E) and LOX-1 KO mice (B, D, F). The graphs show the score of inflammatory cell infiltration (G) and synovial hyperplasia (H) in saline-injected groups at each experimental time. Data are presented as mean ± SD (n= 10, in each group); P<0.05 was regarded as a significant difference (Student’s t-test). N.S, not significant. Scale bars: 100 μm.
