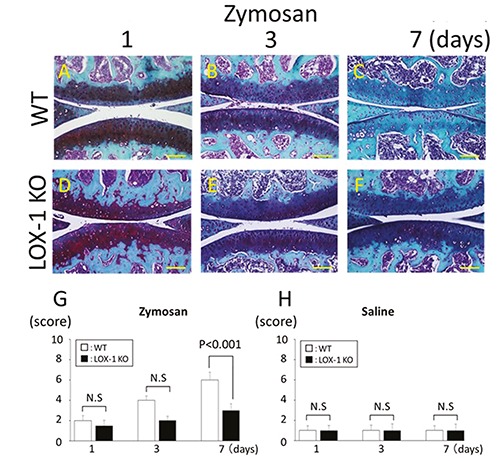
Figure 3.

The panels show representative articular cartilage staining with SFO (A-F). Articular cartilage of WT mice at day 1, 3, and 7 after zymosan injection (A-C). Articular cartilage of LOX-1 KO mice at day 1, 3, and 7 after zymosan injection (D-F). All specimens are in the sagittal direction. The graphs show the score of cartilage degeneration in the zymosan-injected knees (G), and saline-injected knees (H) at each experimental time. Cartilage degeneration was lesser in the cartilage of LOX-1 KO mice (D-F) than in WT mice (A-C) during all experimental times. Data are presented as mean ± SD (n= 10, in each group); P<0.05 was regarded as a significant difference (Student’s ttest). N.S, not significant. Scale bars: 100 μm.
