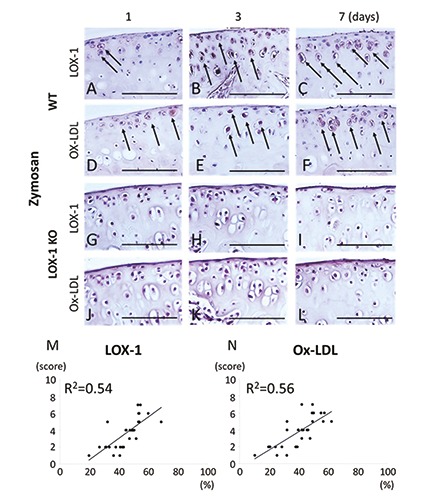
Figure 6.

The panels show representative tibial cartilage immunostaining of LOX-1 and ox-LDL (A-L) at 400× magnification. LOX-1 expression in the cartilage of WT mice at day 1, 3 and 7 after zymosan injection (A-C). Ox-LDL expression in the cartilage of WT mice at day 1, 3 and 7 after zymosan injection (D-F). LOX-1 expression in the cartilage of LOX-1 KO mice at day 1, 3 and 7 after zymosan injection (G-I). Ox-LDL expression in the cartilage of LOX-1 KO mice at day 1, 3 and 7 after zymosan injection (J-L). Although LOX-1 and ox- LDL positive cells are observed in WT mice (A-F), no positive cells are observed in LOX-1 KO mice (G-L) during all the experimental time. The graphs show the correlation between the positive cell rate for LOX-1 (M), ox-LDL (N) and the cartilage degeneration score in WT mice. The positive correlation is observed between positive cell rate for LOX-1 or ox-LDL in chondrocytes and the cartilage degeneration score. Arrows show the LOX-1 or ox-LDL positive chondrocytes. The antibodies used were rabbit anti-mouse LOX-1 polyclonal antibody and rabbit anti-mouse ox-LDL polyclonal antibody. Scale bars: 100 μm.
