Figure 4.

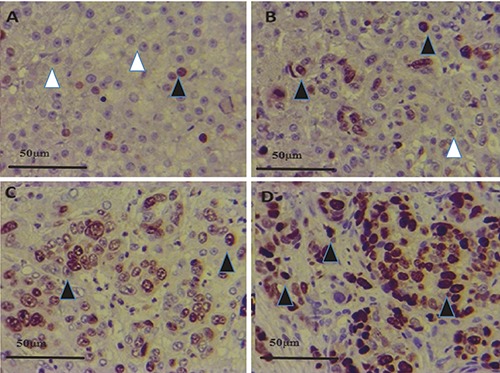
HSP70 expression in control (A), HBV (B), HCC (C) and HBV+HCC (D) liver tissue (immunperoxidase x400). HSP70 positive expression in hepatocytes (black arrowheads) and healthy cells (white arrowhead) are shown.

HSP70 expression in control (A), HBV (B), HCC (C) and HBV+HCC (D) liver tissue (immunperoxidase x400). HSP70 positive expression in hepatocytes (black arrowheads) and healthy cells (white arrowhead) are shown.