Figure.
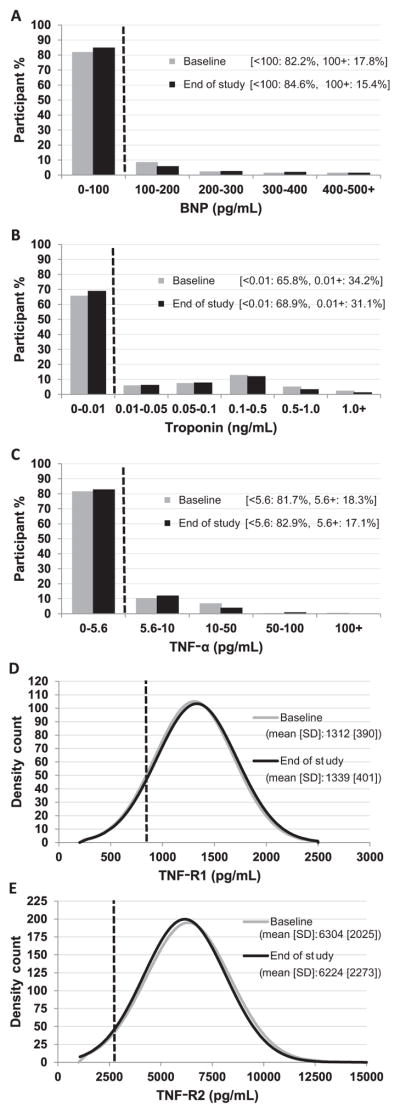
Baseline and end-of-study distributions of measures of A, BNP, B, troponin, C, TNF-α, D, TNF-R1, and E, TNF-R2. A reference line (dashed line) and the percent of participants above a pre-specified abnormal cutoff is illustrated in the graph for BNP (cutoff, 100 pg/mL), troponin (cutoff, 0.01 ng/mL), and TNF-α (5.6 pg/mL). TNF-R1 and TNF-R2 are normally distributed and therefore the mean (SD) is given; the reference line (dashed line) represents the upper normal range reported in the literature (TNF-R1: 821 pg/mL, and TNF-R2: 2622 pg/mL).

