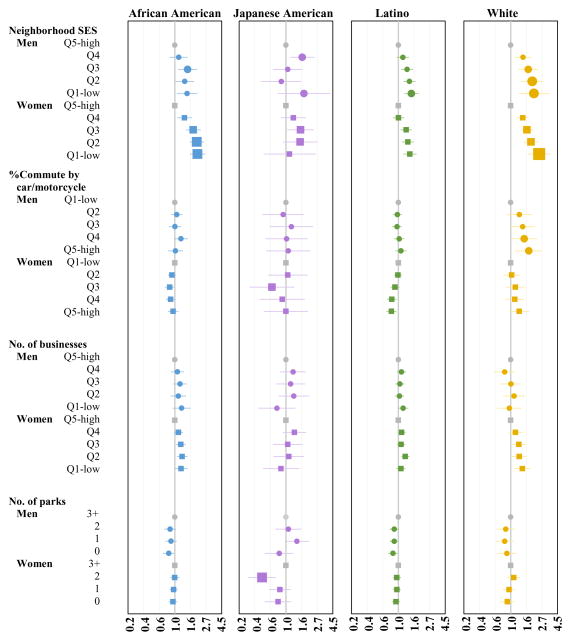
Figure 1.
Odds ratios and 95% confidence intervals for being obese [body mass index (BMI) ≥ 30] compared to normal weight (BMI < 25) among men (circles) and women (squares) in the Multiethnic Cohort residing in California at baseline (1993–1996). Models adjusted for age, marital status, BMI at age 21, smoking and cigarette pack years, alcohol intake, education, moderate and vigorous activity, diet intake (red meat, processed red meat, vegetables and fruits, dairy products, total calories), neighborhood attributes (all variables listed, population density, restaurant environment index, retail food environment index, traffic density), and clustering effect of block group. Neighborhood socioeconomic status (SES) and commute patterns are U.S. Census block group-level measures, with quintiles (Q) based on distribution for block groups in Los Angeles County. Businesses/parks are within walking distance of residence (1.6 km pedestrian network), with categories based on study participant distribution. Symbol size proportional to effect size. Odds ratios on the natural logarithmic scale.

