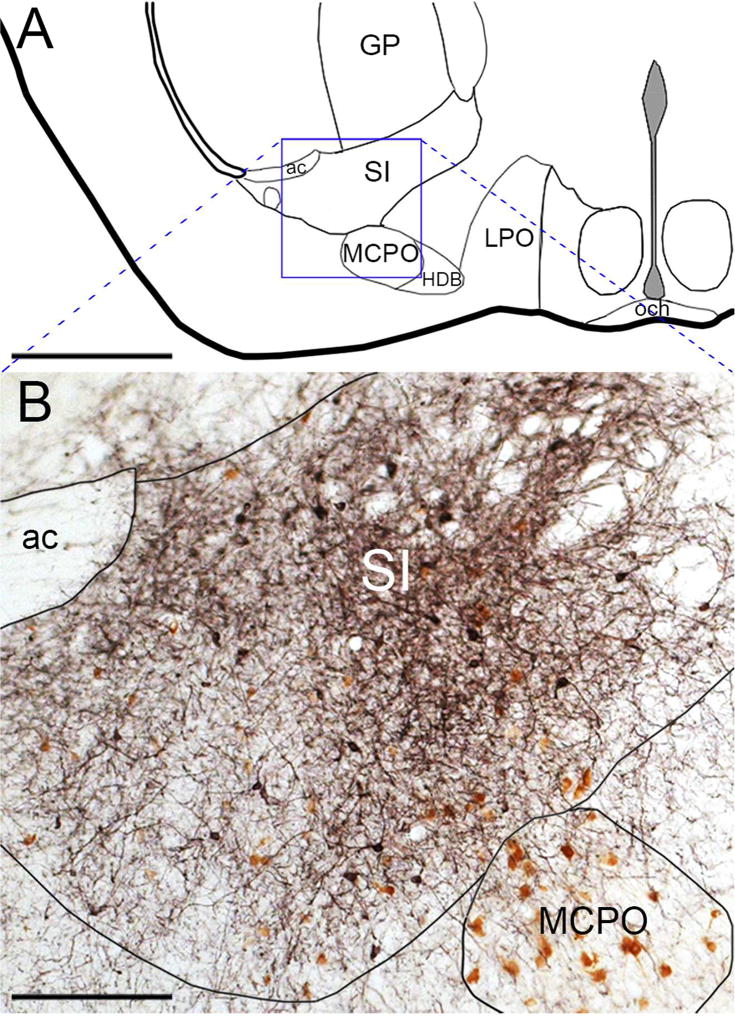
Figure 1. A typical AAV-ChR2 injection site in the SI.
(A) Diagram of the SI/MCPO region. (B) DsRed antisera (black) robustly labels ChR2-mCherry fusion protein in neuronal soma and axons of a vGAT-Cre mouse. DAB (brown) labels ChAT neurons in the SI and MCPO. Scale bars are 1 mm in A and 200 µm in B.

