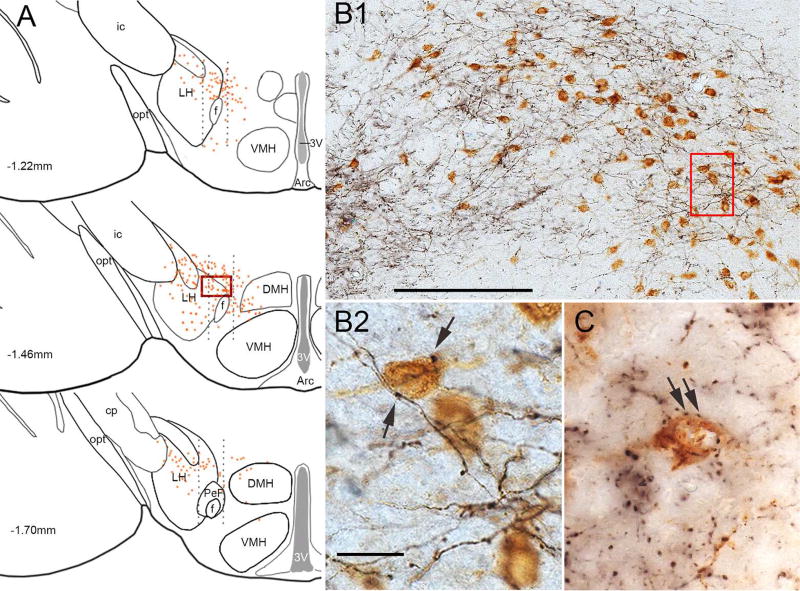
Figure 4. SI innervation of the orexin neurons.
(A) We analyzed three sections (spaced 240 µm apart) through the rostral-caudal extent of the orexin field. Dotted black lines indicate the lateral, perifornical, and medial divisions of the orexin field; orange dots represent individual orexin neurons. (B1) Higher power image of the boxed area in A shows that mCherry-labeled glutamatergic axons (black) are dense within the orexin field, and (B2) Higher power image of the boxed area in B1 shows that mCherry-labeled boutons (arrows) closely appose orexin neurons (brown). (C) After injection of AAV-synaptophysin-mCherry, mCherry-labeled, GABAergic presynaptic terminals (black) closely appose orexin neurons (brown). Scale bars in B1 and B2 are 200 µm and 25 µm, respectively.

