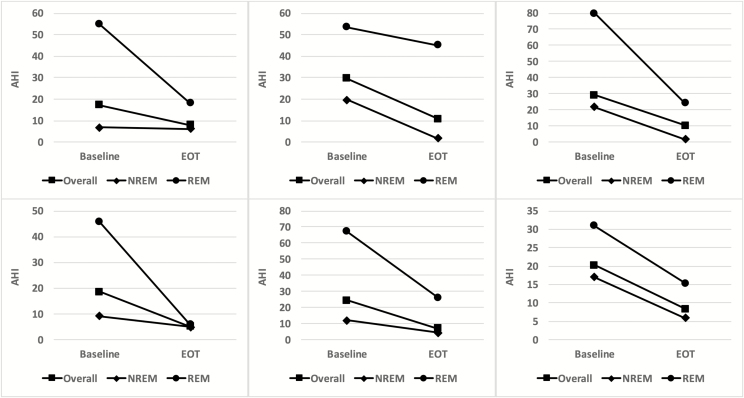
Figure 3.
Treatment-related changes in AHI individual “responders.” Each panel depicts the AHI measured at baseline and at the end of treatment for a single responder (square symbols). In addition, AHI stratified according the NREM sleep (diamond symbols) and REM sleep (circle symbols) are depicted for each of these participants.

