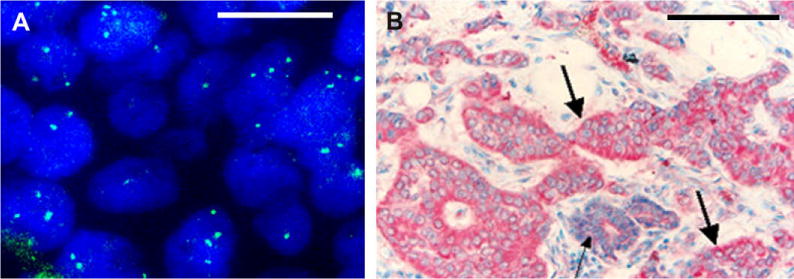
Fig. 1.

Formalin-fixed, paraffin-embedded (FFPE) section from a representative primary breast tumor sample showing: A: Amplification of BP1 gene (green signals) by FISH (100×; magnification bar is 100 μm); B: Immunostaining for BP1 (red). Thick arrows identify invasive lesions with strong BP1 expression. Thin arrows identify normal area with no or weaker BP1 expression (40×; magnification bar is 2.5 mm).
