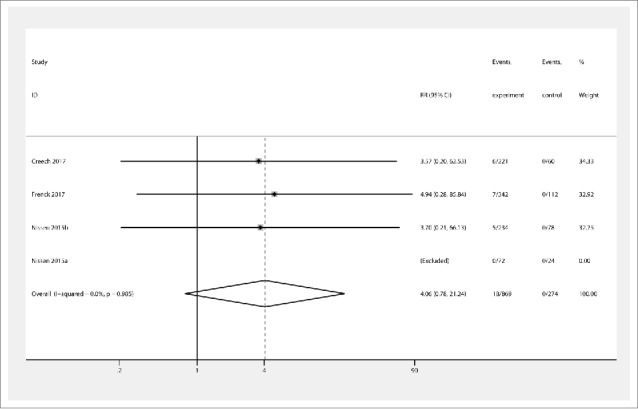
Figure 5.

Forest plot showing RRs for the incidence of severe local reactions following vaccination with Staphylococcus aureus four- and three-antigen vaccines. A significant effect of S. aureus vaccines was assumed if the 95% CI did not include the value 1 for RR. CI confidence interval, RR relative ratio
