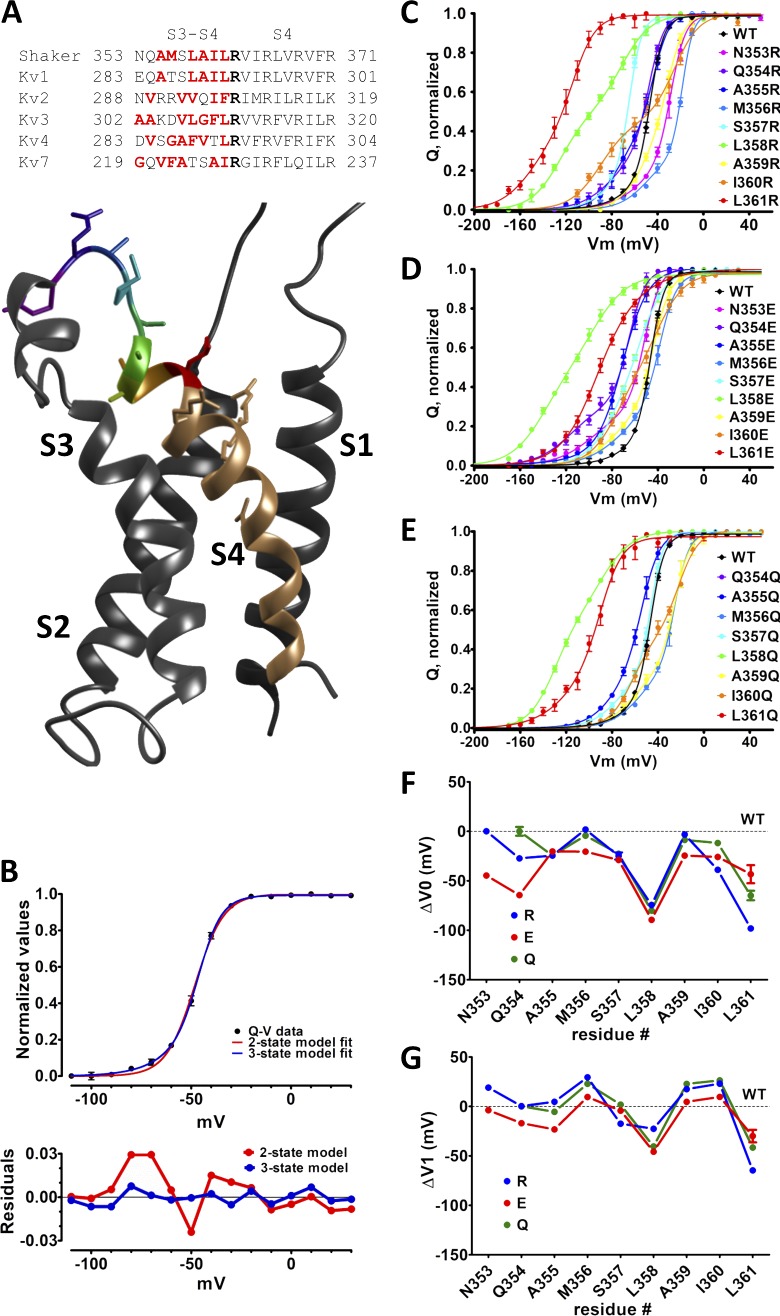
Figure 1.
Residues L358 and L361 in nonconducting Shaker modulates the voltage dependence of its VSD. (A) S3–S4 linker and S4 sequences from Shaker and other voltage-dependent K+ channels, aligned by the putative first sensing charge (bold). For better distinction, hydrophilic residues are in red. A side view of KV1.2 (PDB code 3LUT) is shown with the residues 353 to 361 colored individually. (B) WT Shaker Q-V curve fittings with a two- and a three-state model (see Materials and methods for details) for comparison (top) and the respective residuals (bottom) are shown. (C–E) Q-V curves displaying average (symbols) and SEMs (vertical bars) from Shaker mutated with R (in C), E (in D) or Q (in E), separately in each of the nine residues 353–361 in the S3–S4 linker. All continuous lines are the best fit of three-state model (see Materials and methods). The color code in all Q-V curves matches the one used in the structure shown in A. In all plots, vertical bars from the colored symbols representing each data point denote the SEM. (F and G) The fitted parameters V0 and V1 are shown in F and G, respectively.

