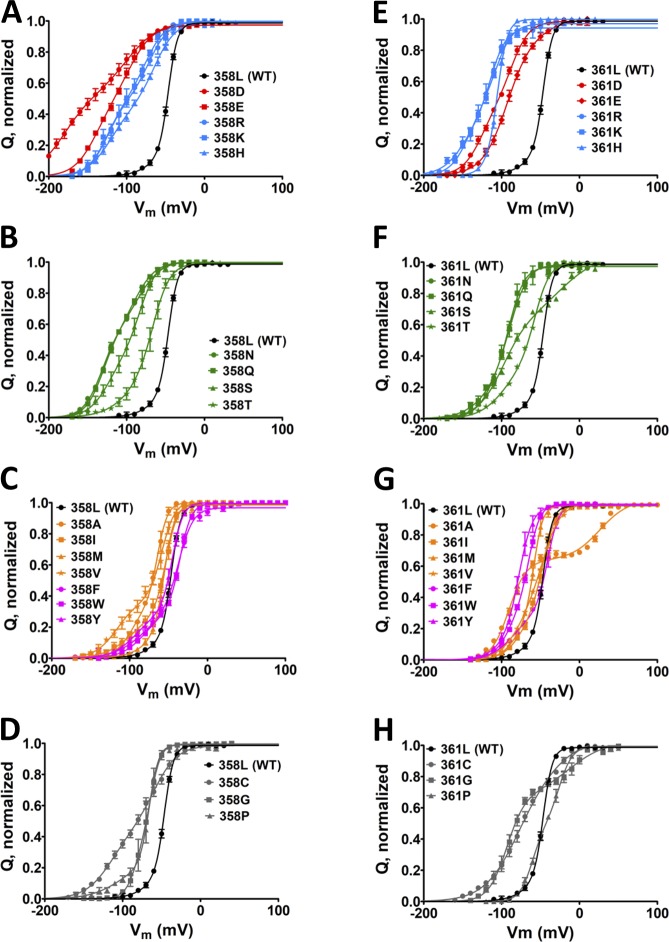
Figure 2.
Q-V curves from both AA scans, L358 and L361, in nonconducting Shaker. (A–H) Averaged Q-V curves from L358X (A–D) and L361X (E–H). For a better visual, in each of the scans, charged AAs (D, E, R, H, and K) mutants are shown in A and E, polar AAs (N, Q, S, and T) mutants are shown in B and F, hydrophobic including aromatic AAs (A, I, L, M, V, F, W, and Y) mutants are shown in C and G, and special case AAs (C, G, and P) mutants are shown in D and H. For reference, the Q-V curves for WT channels are shown in black in all graphs. In all plots, vertical bars from the colored symbols representing each data point denote the SEM. Continuous lines are the best fit of the three-state model (see Materials and methods).

