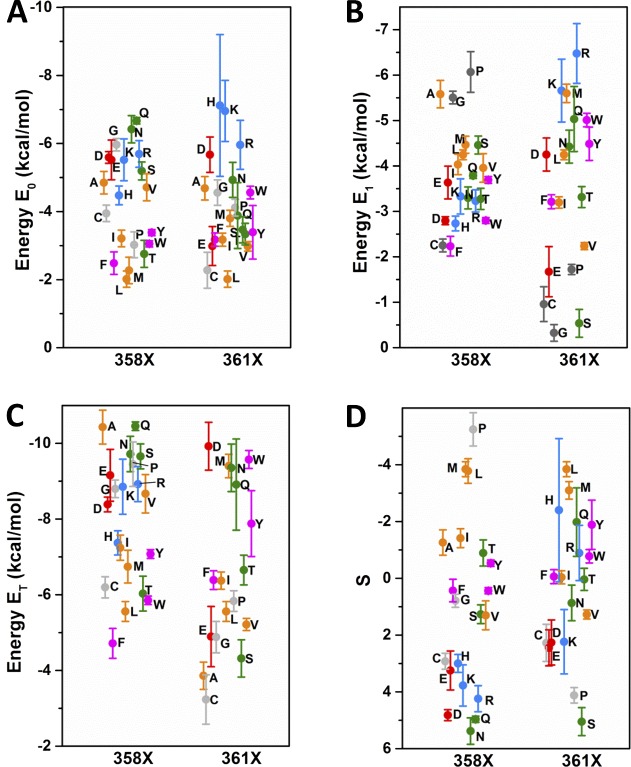
Figure 4.
Sets of energies E0, E1, and ET and factor S values from L358X and L361X. See Materials and methods for details. (A–D) Distribution from both scans as indicated in the graphs of the energy values involved in the first step of the three-state model for VSD activation, E0 (A); in the second step, E1 (B); the sum E0 + E1, ET (C); and the factor S, proportional to the stability of the intermediate state of the VSD (D). The color code in the plot is the same as that used in Fig. 2. The SEM is plotted from each respective data point represented by the colored symbols.

