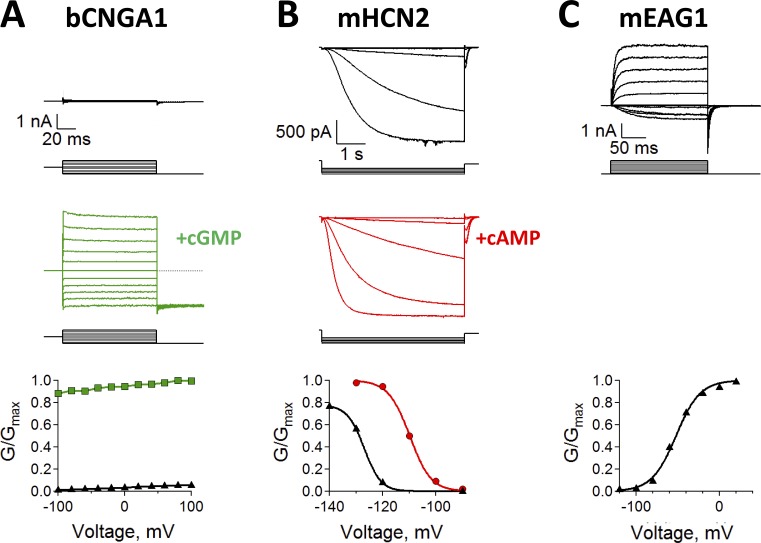
Figure 2.
Diverse functional properties of CNBD channels. (A) Na+ currents recorded from bovine CNGA1 (bCNGA1) channels in the absence (top, black) and presence (middle, green) of saturating cGMP concentrations. Scale bar applies to both top and middle panels. Currents were measured by stepping from 0 mV to test potentials ranging from −100 mV to 100 mV, before stepping to a −100-mV tail potential. The conductance–voltage (G-V) relationship (bottom) was obtained from normalized tail currents. (B) K+ currents recorded from mouse HCN2 (mHCN2) channels in the absence (top, black) and presence (middle, red) of saturating cAMP concentrations. Scale bar applies to both top and middle panels. Currents were measured by stepping from 0 mV to test potentials ranging from −90 mV to −140 mV, before stepping to a 0-mV tail potential. The G-V curve (bottom) was obtained from normalized tail currents. (C) K+ Currents recorded from mouse EAG1 (mEAG1) channels in the absence of cyclic nucleotides (top, black). Currents were measured by stepping from −120 mV to test potentials ranging from −120 mV to 100 mV, before stepping to a −120-mV tail potential. The G-V curve (bottom) was obtained from normalized tail currents.

