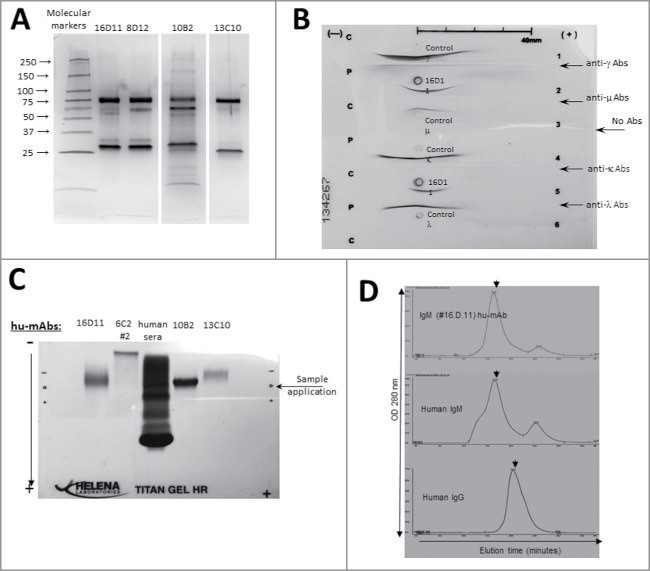
Figure 4.
Structural analyses of anti-HA180-195 hu-mAbs. (A) Silver stain of 8–16% gradient SDS-PAGE gels ran under denaturing and reducing condition for four affinity purified, HA180-195 specific hu-mAbs at 1 μg/lane. (B) Immunoelectrophoresis of 16D11 hu-mAb showing the monoclonal bands of human μ heavy chain and human l light chain as compared with the human polyclonal m heavy chain and l light chain. (C) Agarose Titan gel analysis showing the monoclonality and difference in the electrophoretic mobility of HA180-195 specific hu-mAbs. (D) Histograms of FPLC analysis showing intact pentameric molecules of 16D11 hu-mAb. Arrows in each histogram indicates the earlier elution time for 16D11 IgM and control human IgM pentameric molecules than for human control IgG monomeric molecules as detected at 280 nm.

