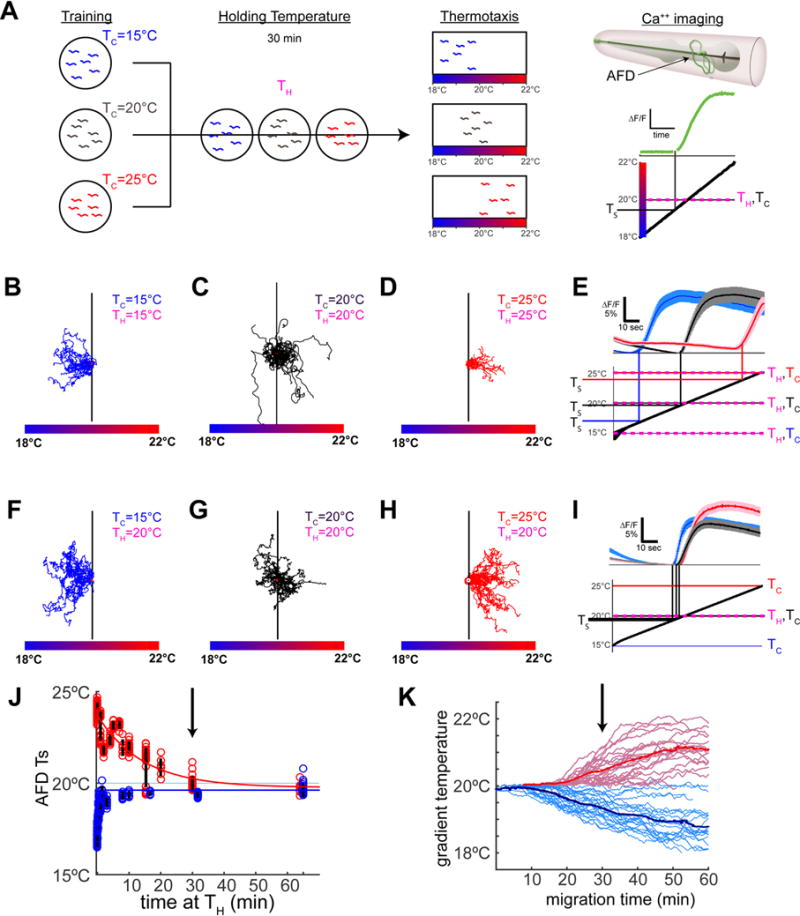
Figure 1. AFD thermosensory threshold adapts within minutes and does not represent the temperature preference memory.

(A) Schematic illustration of the experimental paradigms. Animals cultivated for 4hr either at 15°C, 20°C or 25°C (“Training”) were then held at specified temperatures (“Holding Temperature”, TH) for 30 minutes prior to being tested in behavioral assays (“Thermotaxis”) or calcium imaging in specific neurons (“Ca++ imaging”). The response of a single AFD neuron (green trace) is illustrated as a change in fluorescence (ΔF/F) over time when applying a linear thermal ramp (thick black diagonal line) from 18°C to 22°C. (B–E) Worms trained at 15°C, 20°C, or 25°C were examine d for thermotaxis behavior in B–D and calcium imaging in AFD in E. The mean AFD response threshold for TC=15°C was 16.9°C +/− 0.5°C (blue trace), TC=20°C was 19.9°C +/− 0.5°C (black trace), and TC=25°C was 23.9°C +/− 0.4°C (red trace). Note that when TH=TC, AFD response threshold (TS) correlates with the TC, consistent with previous reports (Clark et al., 2006; Kimura et al., 2004; Ramot et al., 2008a). Traces for individual animals in Figure S1C–E. (F–I) As in B–E, but animals were held at TH=20°C for 30 minutes prior to thermotaxis behavior in F–H or calcium imaging in I. Note that, regardless of TH, animals retain the cultivation temperature memory and perform the thermotaxis behavior (F–H consistent with (Hedgecock and Russell, 1975)). In contrast, the AFD response threshold (TS) adapts to the holding temperature (TH) and all animals, regardless of cultivation temperature memory, respond near TH=20°C as shown in I (TS=19.4°C +/−0.1°C for TC=15°C, 19.8°C +/−0.2°C for TC=20°C, and 19.9°C +/−0.3°C for TC=25°C). Traces for individual animals are in Figure S1F–H. (J) AFD adaption kinetics were assessed in a training paradigm as described in A, but with varying amounts of time held at TH. The threshold TS is plotted for each duration of holding at TH. The time course of adaptation in AFD for cooling temperatures (TH=20°C & TC=25°C, tau=14min) is slower than that observed for warming temperatures (TH=20°C & TC=15°C, tau=45sec). Yet, note that by 30 minutes (black arrow) sensory threshold responses in AFD have adapted to very near TH regardless of TC. See also Figure S2. (K) Behavioral kinematics showing migration of animals over time illustrate that migration onset correlates well with AFD adaptation kinetics, with peak migration occurring around 30 minutes after worms were placed at 20°C (black vertical arrow). See also Figure S2X. Error bars denote SEM.
