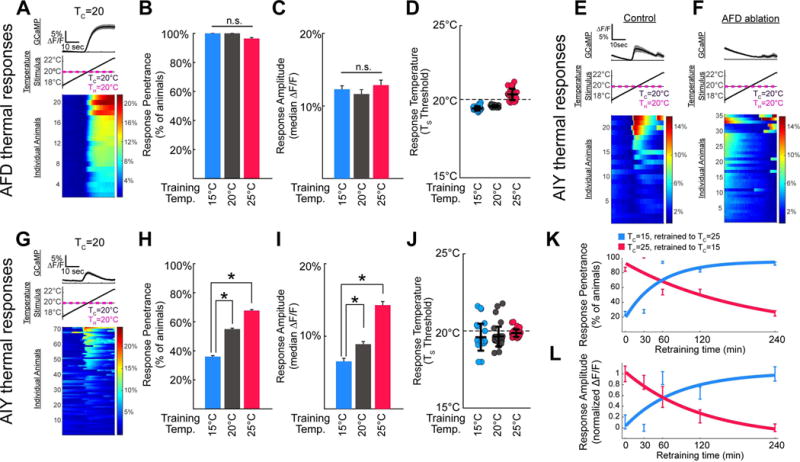
Figure 2. Postsynaptic response in AIY correlates with the cultivation temperature memory.

(A) Illustration of the experimental paradigm, shown in AFD for a single condition (TC=20°C; for heat maps of other conditions please see Figure S4). The average GCaMP signal is represented in the top panel, stimulus protocol in the middle panel and individual responses in the bottom panel, with each row representing a single worm. Total number of worms tested are represented to the left of the calcium traces (under “individual animals”), and percentage change ΔF/F is represented in the color bar to the right. (B–D) Comparison of calcium dynamics of AFD neurons of animals trained at TC=15°C (blue), TC=20°C (grey), or TC =25°C (red) then tested at TH=20°C. Under all training conditions, the AFD of nearly every animal tested had detectable responses to the warming stimulus, with no significant effect of training condition (n=28, 21, and 28 respectively), as shown in B. Response amplitudes were similar among groups with no significant effect of training condition, as shown in C. In each case, the threshold for AFD thermal response was near the testing temperature, TH, rather than the training temperature TC, as shown in D. (E,F) AIY imaging reveals an AFD-dependent thermally evoked response near the threshold for AFD consistent with previous studies (Clark et al., 2006). Calcium dynamics of single AIY neurons in wild-type in E or AFD-ablated in F animals; see also Figure S3. (G–J) Animals trained as in A–D at TC=15°C (blue), TC =20°C (grey), or TC =25°C (red) then tested at TH=20°C, but with calcium imaging performed in AIY (the AFD postsynaptic partner). Note that while AFD responds robustly in all conditions, as shown in B and C, the AIY response frequency in H and amplitude in I varies significantly depending on the cultivation temperature memory. Like AFD, responses are observed near the testing temperature, TS (we note additional AFD-independent response were also seen, and account for the increase variability in J as compared to D (see also Figure S3)). (K–L) AIY response properties change with kinetics that mirrors those of behavioral memory. After initial training at TC=15°C (blue) or TC=25°C (red), animals were retrained for varying amounts of time at 25°C or 15°C, respectively. Vertical bars represent SEM with n=12–13 animals per time point for initial TC=25°C in red and n=13–24 animals per time point for initial TC=15°C in blue. Solid think lines represent exponential fits for response penetrance in K (red R2=0.79 and blue R2=0.76) and response amplitude in L (red R2=0.98 and blue R2=0.67). We note that a sigmoidal curve fit, particularly for shifts from TC=15°C (in blue), could also fit the data. But importantly, our findings indicate that the adaptability of response penetrance and amplitude in AIY follow a time-course similar to that seen for the timing of behavioral retraining. Consistent with G–J, both the AIY response penetrance in K and amplitude in L correlate with the initial behavioral preference. These features are also stable for 30min, and then gradually reverse after 1 hour with complete reversion seen by 4 hours of retraining. Our observations closely match previous reports of the time-course for retraining of the behavioral memory (Hedgecock and Russell, 1975). * denotes p<0.05 by Mann-Whitney-Wilcoxon test for continuous amplitude data and by Fisher’s Exact test for penetrance data. Error bars denote SEM.
