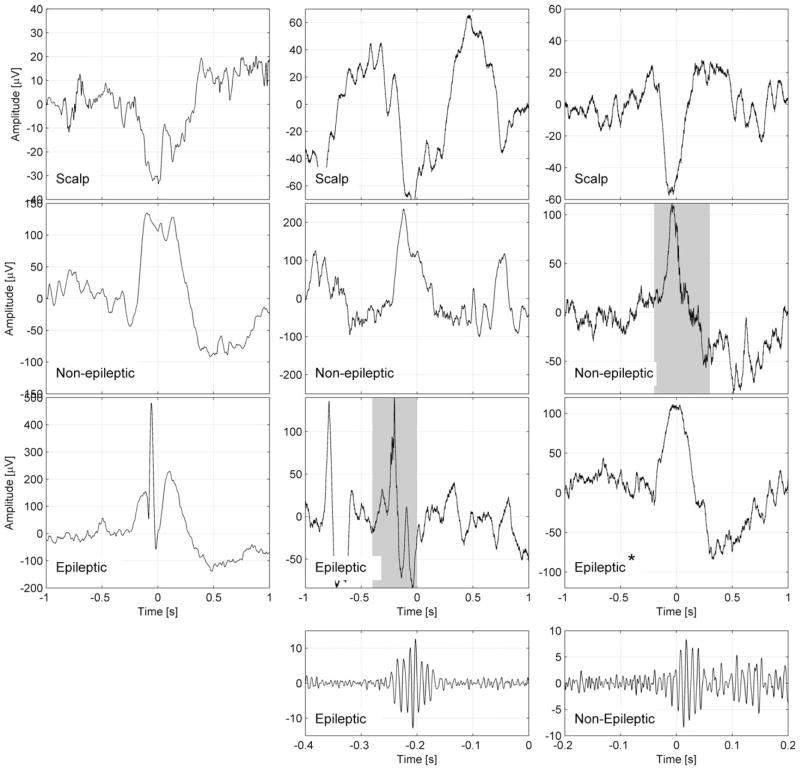
Figure 4.
Representative examples for the coupling of epileptic spikes and high-frequency oscillations (HFOs) across the slow wave cycle. Examples are shown of a slow wave and an epileptic spike (left panel), a slow wave and an HFO in a channel with epileptic activity (middle panel), and an HFO in a channel with normal electroencephalographic (EEG) activity (right panel). The top row shows the slow wave in a scalp channel, the second row shows the same time period for an intracranial channel with normal EEG activity, and the third row shows an intracranial channel with epileptic EEG activity. The fourth row shows the ripple band signal with a different time and amplitude scale, corresponding to the shaded periods in the intracranial channels. All channels are in the left frontal region; each example corresponds to a different patient. The scalp slow wave in the right panel is of shorter duration than the scalp slow waves in the left and middle panels. *In this example, a normal sleep slow wave with no epileptic spike is seen in a channel designated as epileptic because it has spikes at other times. Note that the spike and the HFO in the intracranial channel with epileptic activity (middle) occurs prior to the peak of the scalp negative half-wave, whereas the HFO in the channel with normal EEG activity (right) occurs after the peak of the scalp negative half-wave. Source: Frauscher et al.,82 published open access using a Creative Commons Attribution CC-BY licence.

