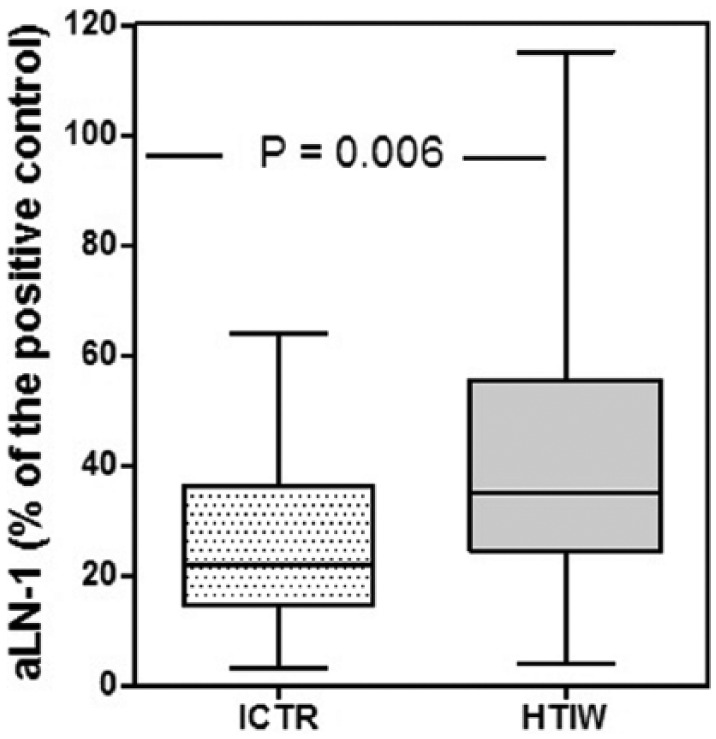
Figure 2.

IgG-aLN-1 levels detected by ELISA in follicular fluids from 44 infertile women with Hashimoto’s thyroiditis (HTIW) and 28 infertile controls (ICTR). The data are depicted as box-plot diagrams, with the box encompassing the range of values from the 25th percentile (lower bar) to the 75th percentile (upper bar). The horizontal line within the box represents the median, and the vertical lines represent maximum and minimum values.
