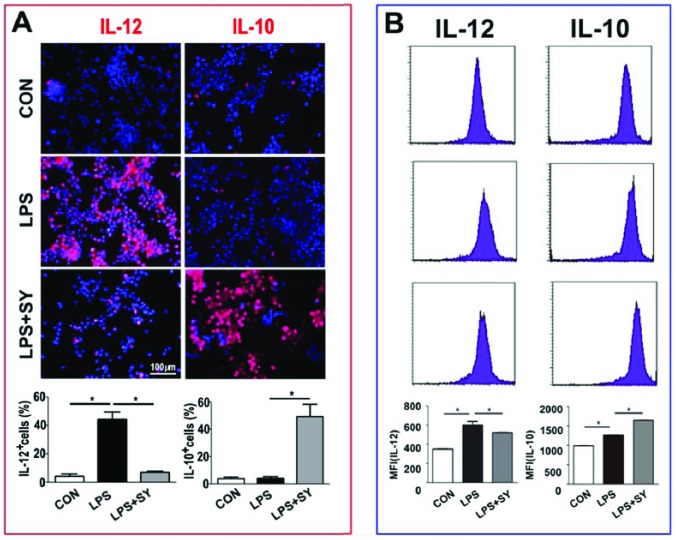
Figure 6.
Influence of SY on LPS-induced IL-12 and IL-10 production in BV2 microglia. BV2 microglia were treated with LPS (0.5 μg/mL) or LPS (0.5 μg/mL) plus SY (80 μg/mL) for 48 h. Production of IL-12 (M1) and IL-10 (M2) was measured by immunocytochemistry staining (a) and flow cytometry (b). Quantitative results are expressed as mean ± SEM from three independent experiments with similar results (in triplicate/each experiment). *P <0.05.

