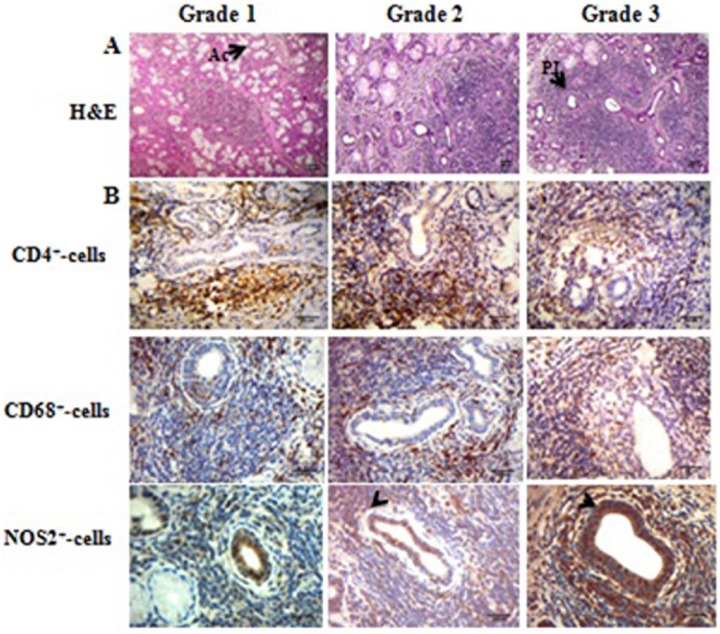
Figure 6.
(a) A representative example of hematoxylin and eosin-stained diseased salivary glands. For grades 1–3, refer to the legend in Figure 2. Note the extensive mononuclear cell infiltration and tissue disruption. Ac, acini; PII, periductal inflammatory infiltrate. Original magnification ×100. (b) A representative example of CD4, CD68, and NOS2 expression. Patients from the three groups are presented. The arrow points to a single-positive cell for NOS staining. Original magnification ×400.

