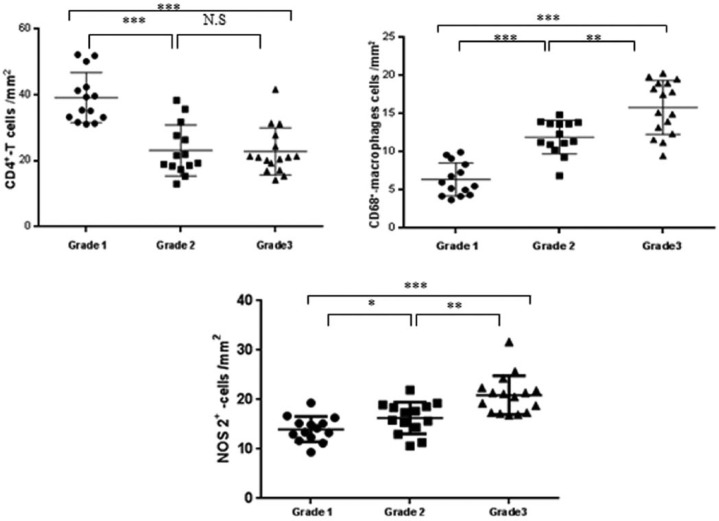
Figure 7.
CD4+, CD68+, and NOS2+ cells according to the grade. For grades 1–3, refer to the legend in Figure 2. CD4+ T cells decreased with the grade, whereas CD68+ and NOS2+ cells increased. NS, non-significant. P values are *<0.05, **<0.01, and ***<0.001.

