
Figure 5.
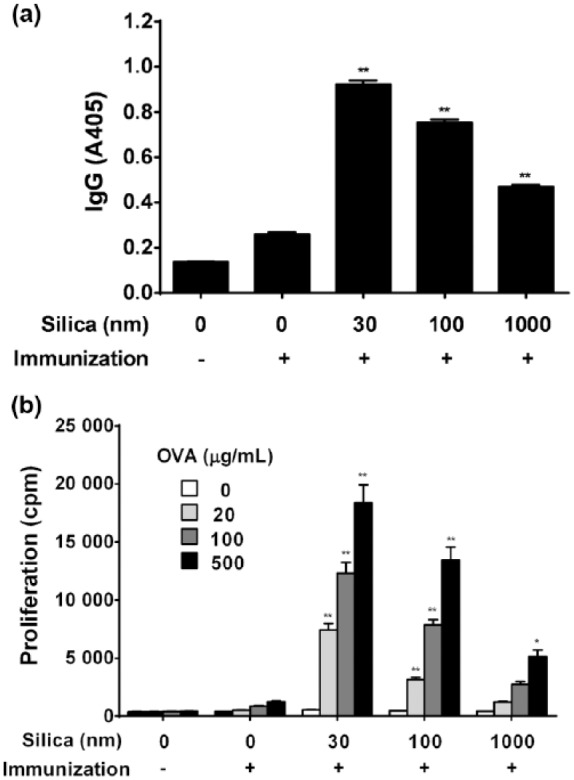
Effect of variously sized SPs on anti-OVA IgG antibody production and proliferation of splenocytes to OVA. Mice were i.p. injected with 100 µg of OVA with or without 30, 100, or 1000 nm of SPs (Day 0). PBS alone was used as a control. (a) On Day 21, anti-OVA IgG antibodies in sera were determined by ELISA. Values are expressed as the mean ± SEM of five mice. (b) Effect of variously sized SPs on proliferation of splenocytes to OVA. On Day 21, spleens were removed, cells isolated, pooled, and then incubated with 20, 100, or 500 µg OVA/mL to measure the proliferative capacity (as outlined in the Methods). Values are the mean ± SEM of triplicate cultures/cohort. cpm, counts per minute; PBS, phosphate-buffered saline; OVA, ovalbumin. *P <0.05, **P <0.01 vs. OVA/PBS (Dunnett’s test).