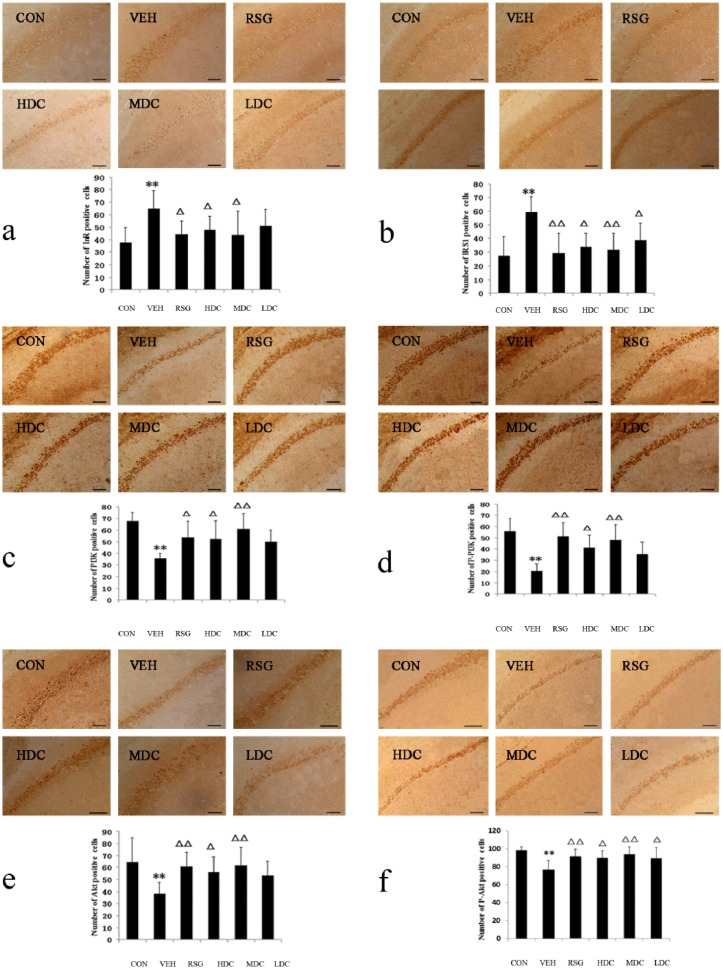
Figure 1.
The number of positive-stained cells of InR, IRS-1, PI3K, p-PI3K, AKT and p-AKT in IHC staining. CON, normal control group; HDC, high-dose curcumin group; LDC, low-dose curcumin group; MDC, medium-dose curcumin group; RSG, rosiglitazone maleate group; VEH, model group. Compared with the CON group, **P <0.01, *P <0.05; compared with the VEH group, ΔΔP <0.01, ΔP <0.05. (a) The number of InR positive-stained cells in IHC. (b) The number of IRS-1 positive-stained cells in IHC. (c) The number of PI3K positive-stained cells in IHC. (d) The number of p-PI3K positive-stained cells in IHC. (e) The number of AKT positive-stained cells in IHC. (f) The number of p-AKT positive-stained cells in IHC.

