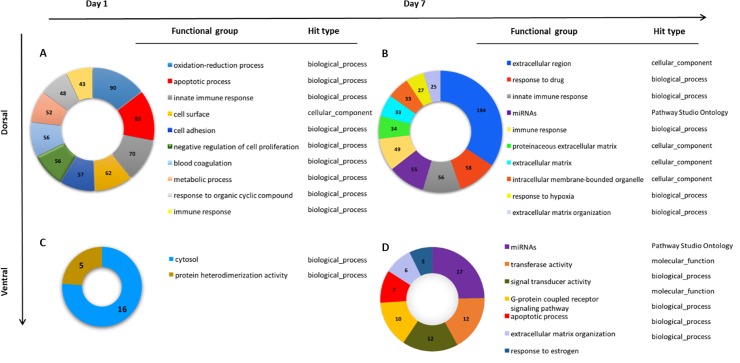
Fig 2. GSEA analysis was performed on a list of significantly differentially expressed genes using a cut off ≥ 1.4 fold change and p-value ≤ 0.05.
Pie charts show numbers of genes from experimental data present in each functional category listed in the legend. The order of listing of functional groups is determined by the number of genes present in each category. Hit obtained from Gene Ontology (GO) categories: ‘molecular_function’, ‘cellular_component’ ‘biological_process’ and ‘Pathway studio ontology’ (A) Enriched functional groups in dorsal retina 1 day following PT injury compared to dorsal uninjured retina yielded significant differences in 88 functional groups. The top 10 functional groups listed based on number of genes present in each functional group (B). Enriched functional groups between dorsal retina 7 days following PT injury and dorsal uninjured retina yielded 67 significant functional groups. (C) Enriched functional groups in ventral retina 1 day following PT injury compared to ventral uninjured retina: only 2 significant functional groups were enriched. (D) Enriched functional groups in ventral retina 7 days following PT injury compared to ventral uninjured retina yielded 7 significant functional groups.

