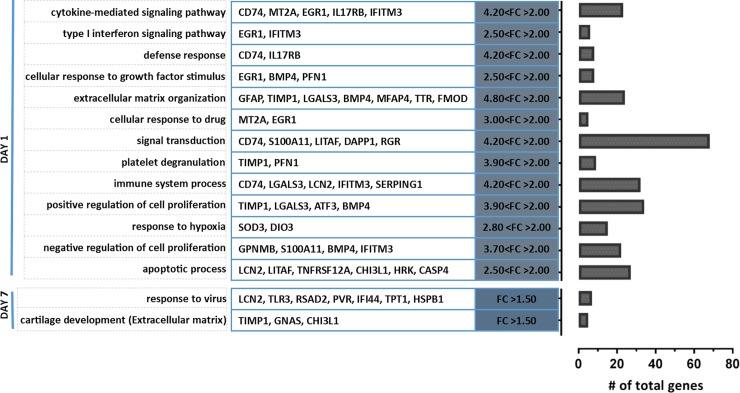
Fig 3. GSEA of differentially expressed genes (FC > 1.4, p-value < 0.05) between dorsal and ventral retina, showing GO classified biological_functions at day 1 and day 7 after PT injury.
All biological_function clusters are upregulated in dorsal retina when compared to ventral retina. Top 10 significant (p-value < 0.05) biological_functions shown for day 1 with a list of contributing genes that are differentially expressed by fold change > 2, p-value < 0.05. Only 2 clusters were enriched from differentially expressed genes between dorsal and ventral retina at day 7 after injury. The genes listed are differentially expressed by a FC > 1.5. The bar graph depicts the total number of genes that contribute to each functional cluster.

