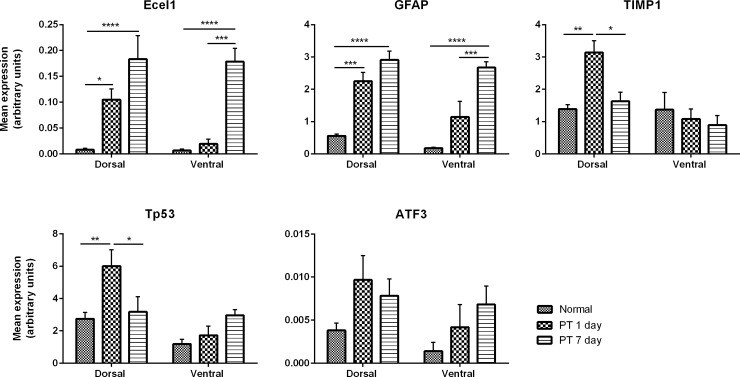
Fig 4. Real-time quantitative PCR confirmation of microarray findings.
RT-qPCR analysis of 5 genes that were shown by microarray analysis to be differentially regulated following PT injury in dorsal and ventral retina at days 1 and 7. Data are expressed as mean±SEM expression of calculated concentration and normalised to 3 housekeeper genes. The same retinal RNA tissue was used as that for microarray analysis. (A) Endothelin converting enzyme-like 1 (Ecel1). (B) Glial fibrillary acidic protein (GFAP). (C) Tissue inhibitor of metalloproteinases 1 (Timp1). (D) Tumor protein 53 (Tp53). (E) Activating transcription factor 3 (ATF3). Statistical significance is indicated by asterisks (* p-value < 0.05, ** p-value < 0.01, *** p-value <0.001, **** p-value <0.0001).

