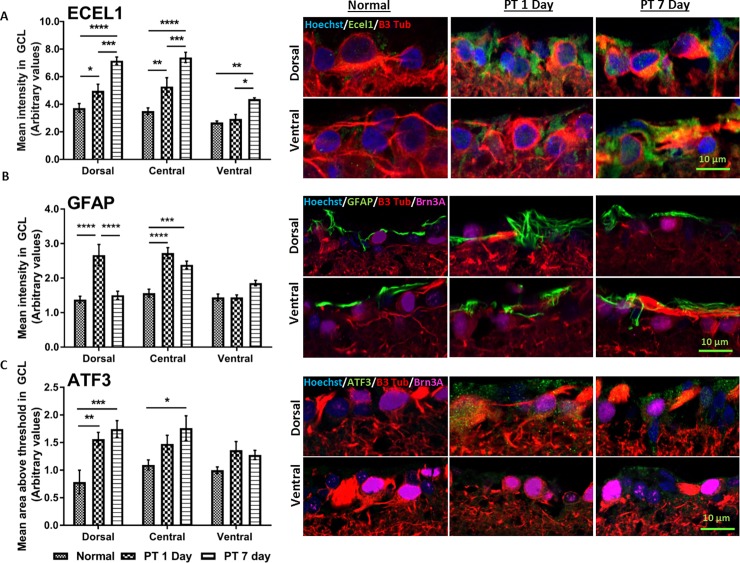
Fig 5. Immunoreactivity of Ecel 1 GFAP and ATF3 in retinal sections.
(A) Endothelin converting enzyme-like 1 (Ecel1), (B) Glial fibrillary acidic protein (GFAP) and (C) Activating transcription factor-3 (ATF3); representative images shown for dorsal and ventral retina. Semi-quantification of immunointensity was performed on the retinal ganglion cell layer (GCL) in dorsal, central and ventral retina on normal uninjured animals and the retina of animals at 1 and 7 days following PT. Error bars show the standard error of the mean (SEM) for each experiment. Statistically analysis conducted on each region and significant differences between retinal tissue of injured and uninjured ON are indicated by asterisks (* p-value < 0.05, ** p-value < 0.01, *** p-value <0.001). Scale bar = 10 μm.

