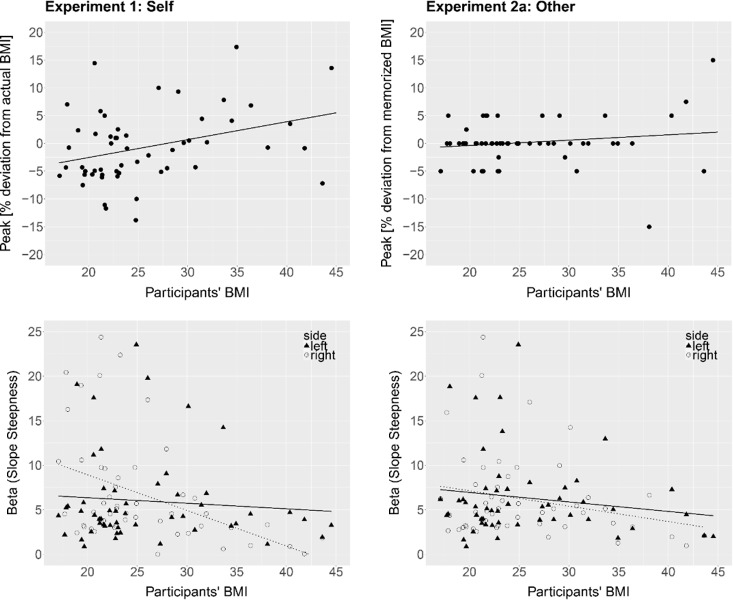
Fig 4.
Top: Percent deviation of the estimated own body size (Experiment 1, left) and estimated memorized body size (Experiment 2a, right) from actual BMI (in %-BMI units) as a function of participants’ BMI in the 1AFC task. The lines represent regression lines. Bottom: Beta values (slope steepness of the yes-answer distribution) for presented bodies smaller (left side of the peak; triangles, solid line) and bigger (right side of the peak; circles, dotted line) than estimated own body size (Experiment 1, left) and estimated memorized body size (Experiment 2a, right) as a function of participants’ BMI in the 1AFC task. Higher beta values indicate greater sensitivity to %-BMI changes. The lines indicate the regression lines.

