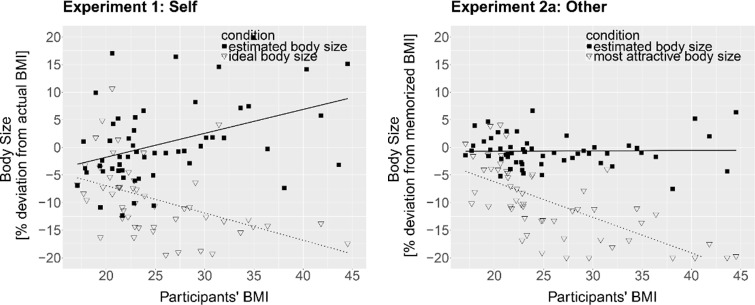
Fig 5.
Left: BMI deviation [in %] of the estimated own body size (squares, solid line) and adjusted ideal body size (triangles, dotted line) as a function of participants’ BMI in the MoA task of Experiment 1. Right: BMI deviation [in %] of the estimated memorized body size (squares, solid line) and adjusted most attractive body size (triangles, dotted line) as a function of participants’ BMI in the MoA task of Experiment 2a. The lines represent regression lines.

