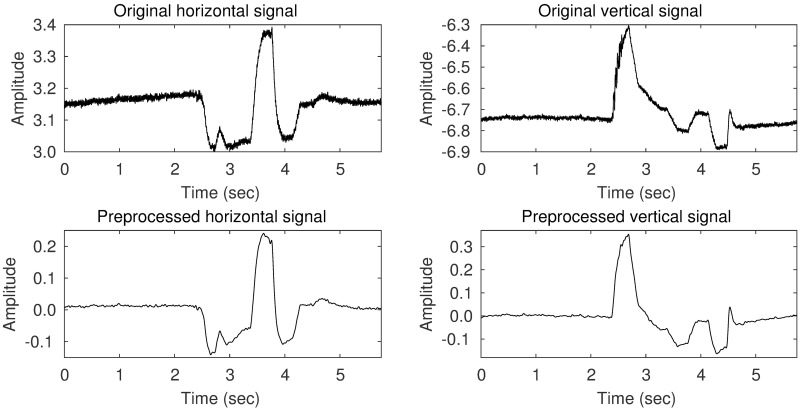
Fig 2. An example of a raw EOG signal and the corresponding processed signal.
The signal corresponds to an eye movement sequence of “up, down, right, left, right, and down.” The top two graphs are the original signals and represent the horizontal and vertical movements, respectively. The bottom two graphs show the pre-processed signals (after applying a DC blocker and a low pass filter), which have smaller noise components.

