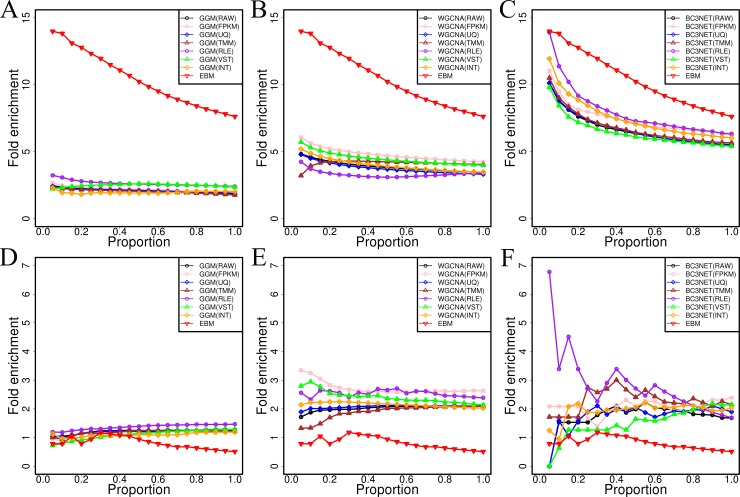
Fig 2. Enrichment folds of different algorithms for co-expression network inference.
A) Comparing to GGM for standard positive links. B) Comparing to WGCNA for standard positive links. C) Comparing with BC3NET for standard positive links. D) Comparing with GGM for standard negative links. E) Comparing with WGCNA for standard negative links. F) Comparing with BC3NET for standard negative links. In the legends, the RAW, FPKM, UQ, TMM, RLE and VST represented the networks obtained by the single RNA-seq data set; INT indicated intra-method consensus networks established by integrating the predictions of different RNA-seq data sets, EBM denoted high-quality gene co-expression network obtained by integrating all intra-method consensus networks.

